Visme offers several data widgets for you to quickly visualize key statistics, metrics and data points. Data widgets can be found within the Data tab along with all of Visme’s other data visualization features. They can be used to show a value such as percentages, distance, time, and space and to compare those values visually within your content. Here’s how:
1
From the editor window of your project, select Data from the left panel and then click on Data Widgets.

2
From there, select whether you want to add a Basic data widget or if you prefer to add a 3D Data widget to present your data in a different way. Each widget serves a specific purpose, allowing you to transform small pieces of data into more engaging forms of content.

Radial Gauges
Radial Gauges are a great way to easily visualize a metric as a percentage showing a single value in relation to the whole on a circular widget, like a pie or donut chart.
1
Select any radial gauge you would like to use. Once you have decided, click or drag and drop the widget in your canvas
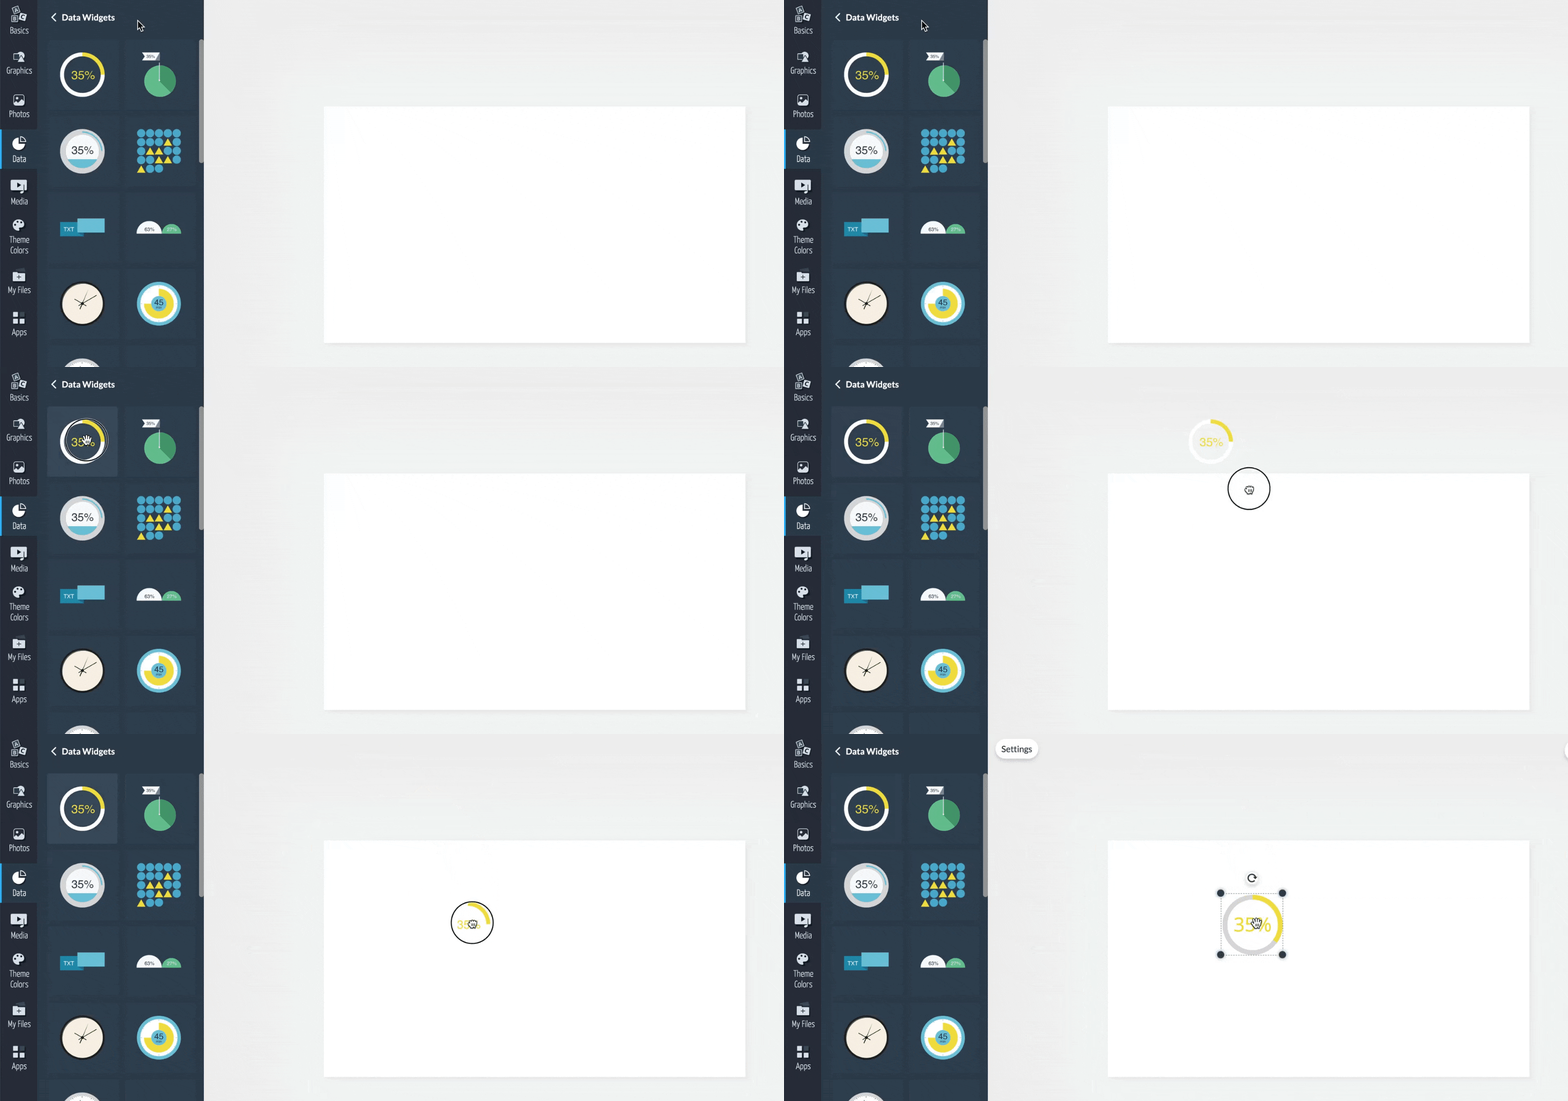
2
You can customize the widget by selecting it and modifying the Settings on the left side of the top menu. From there, you will be able to customize the appearance of the widget by changing the Flag, Range, and Progress colors.
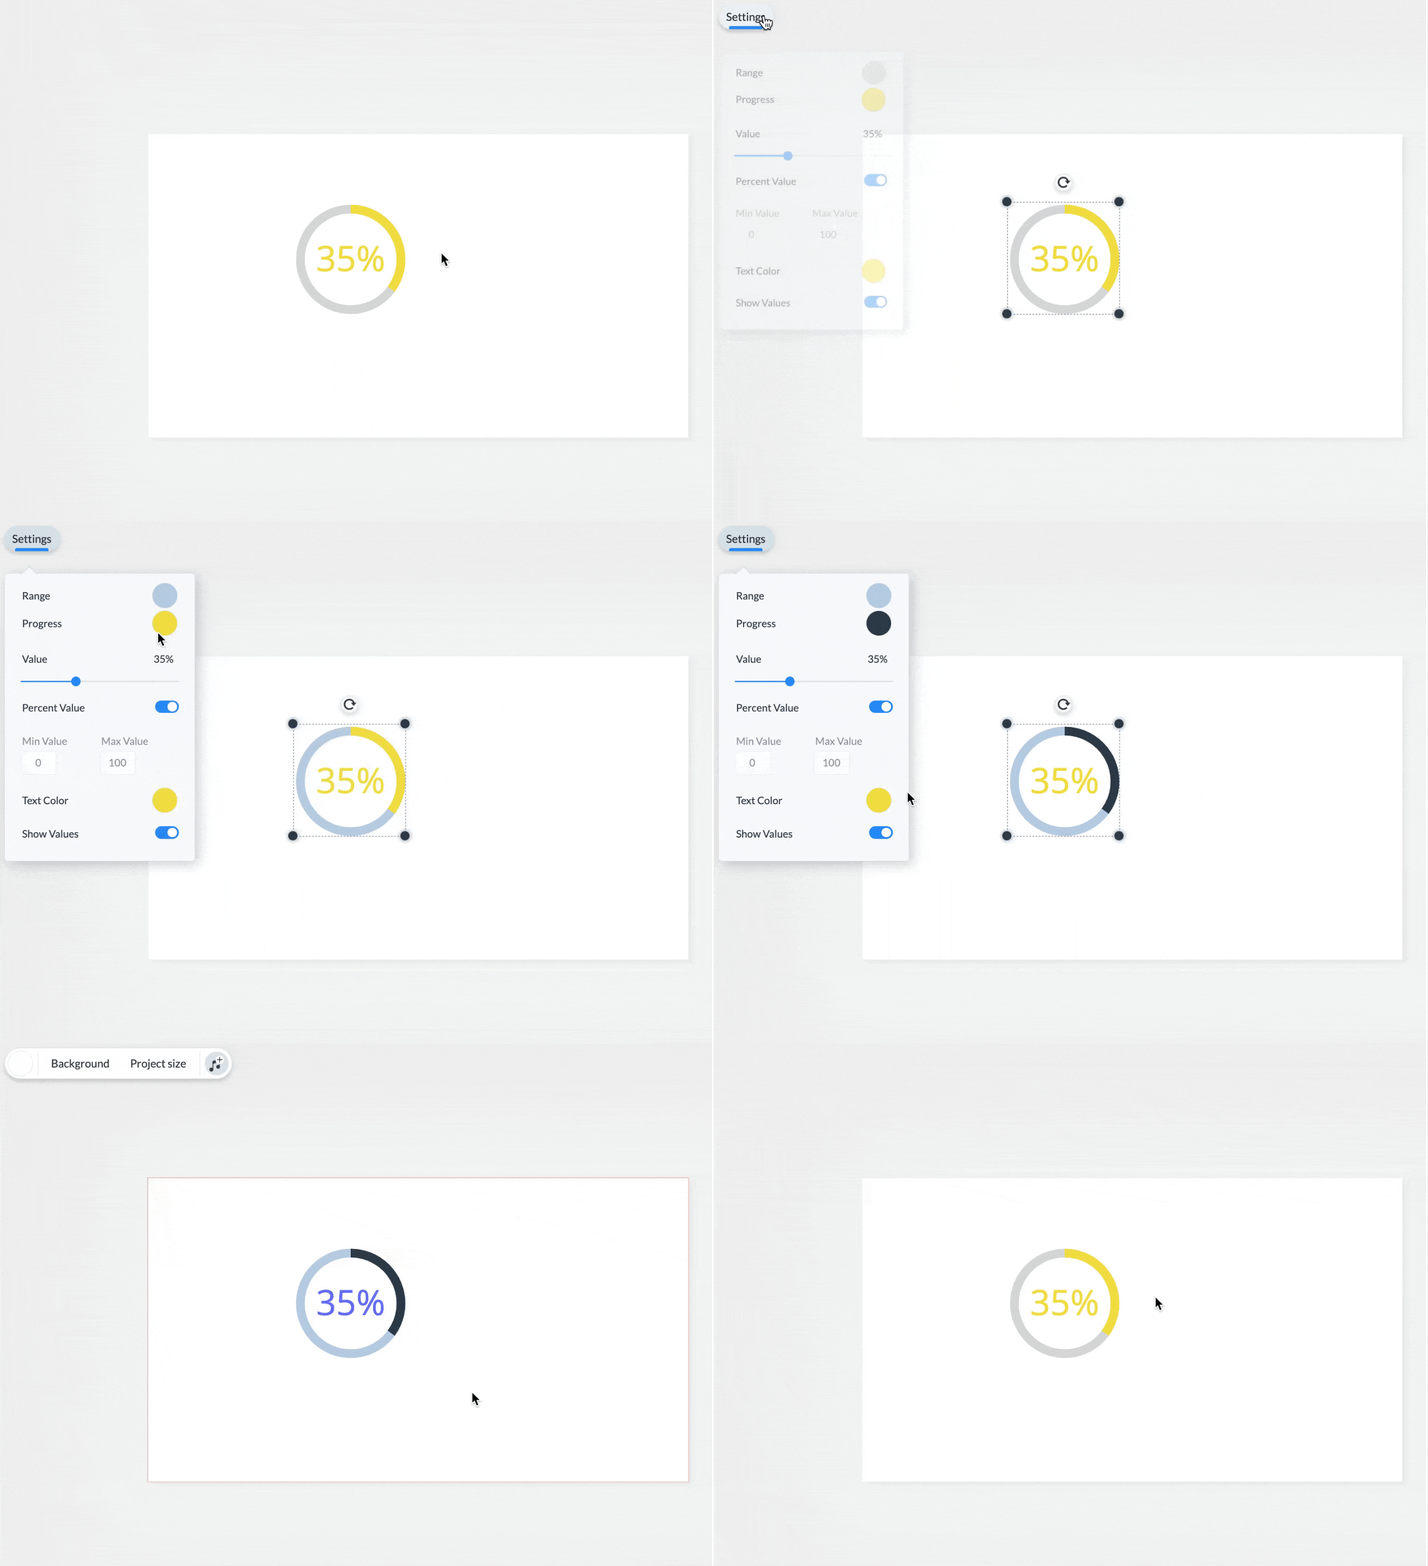
3
From there, you can also set the value by using the Value slider, choose whether or not to display them as a Percent Value or a whole number, enter Min and Max values for your number range, and even choose whether you want to show the value or not by turning the Show Value switch ON/OFF.
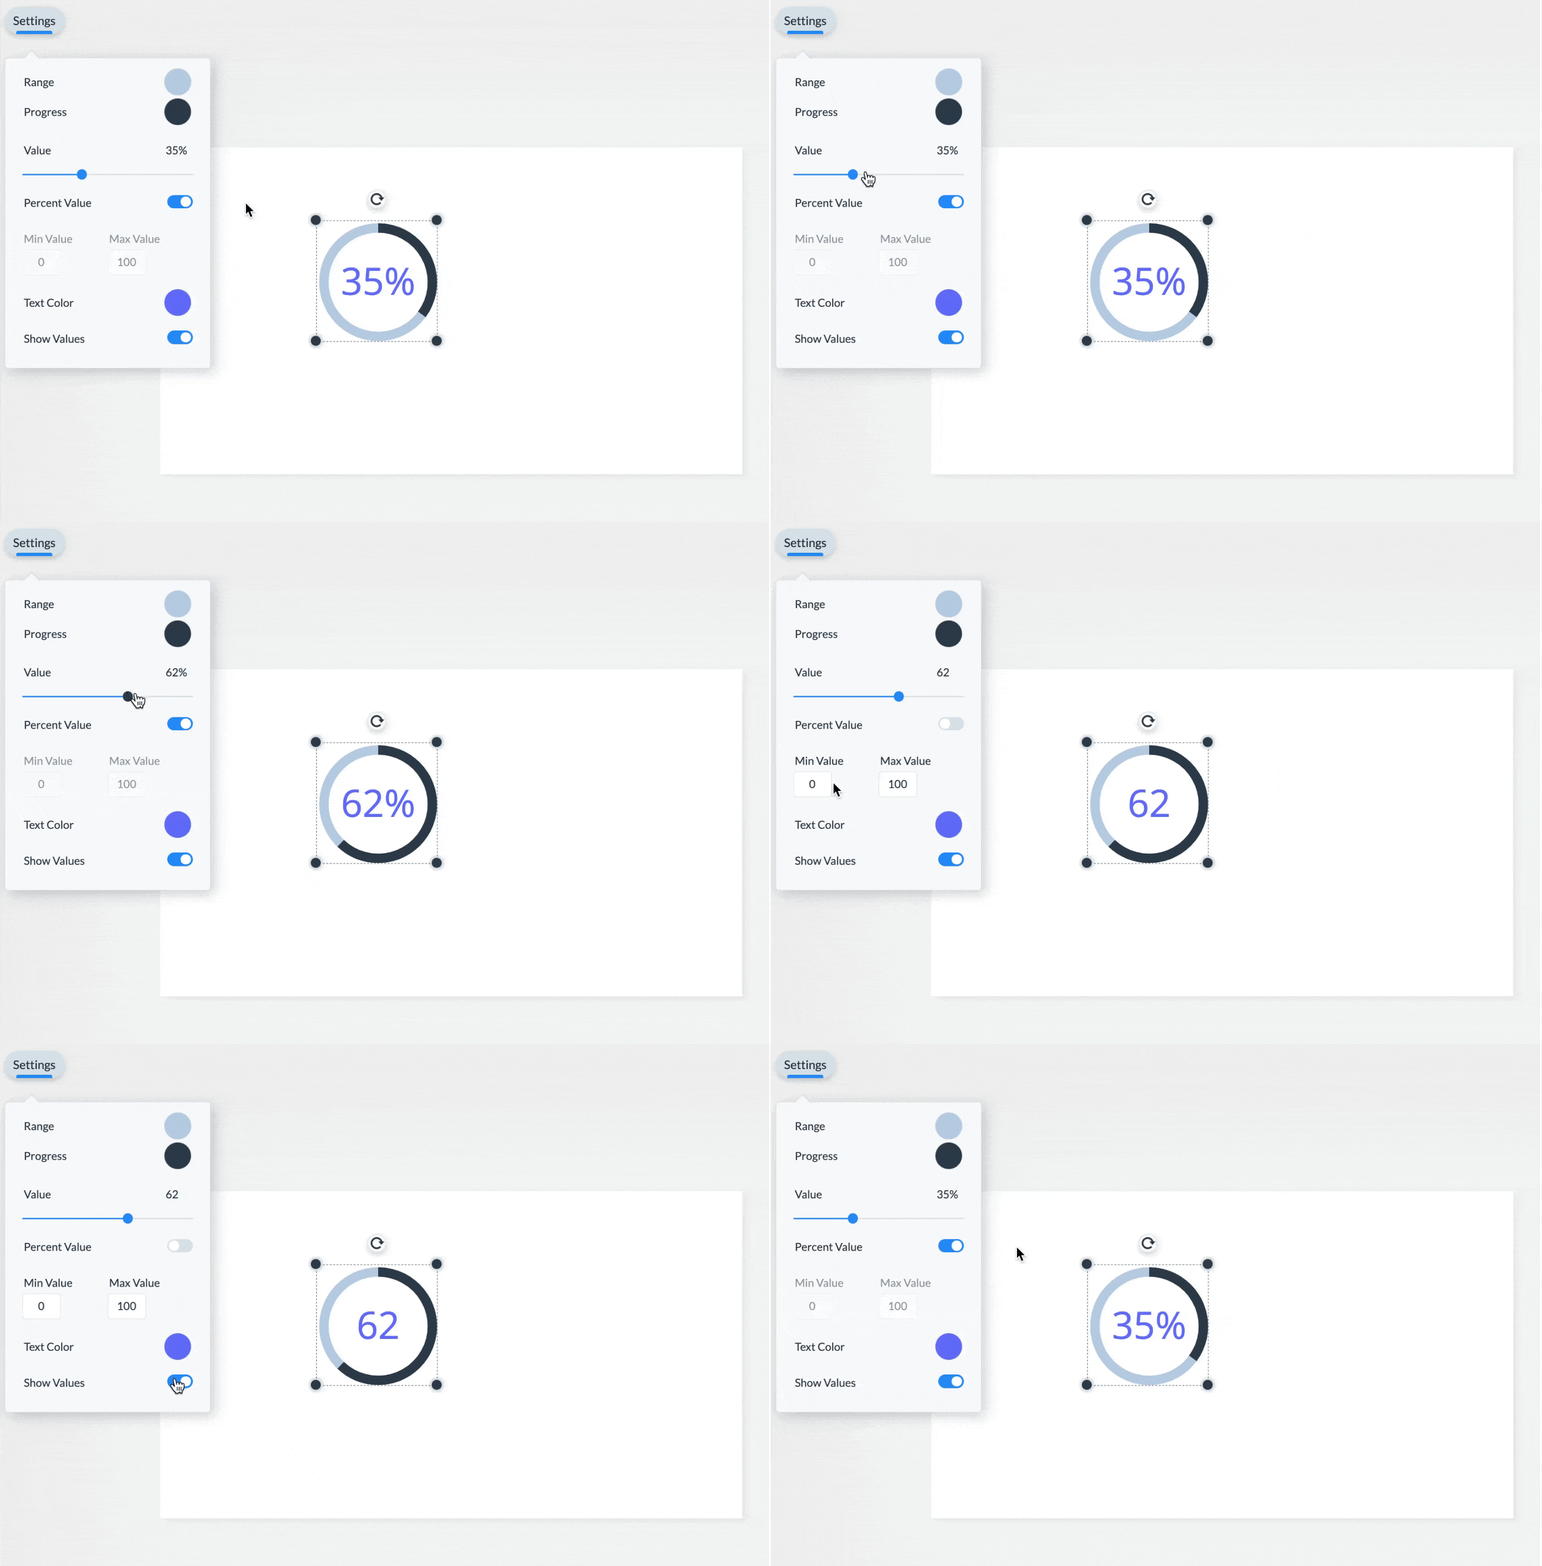
Clocks
Clock widgets can be used to display different time zones with hours, minutes, and seconds pointers.
1
Select any clock widget you would like to use. Once you have decided, click or drag and drop the widget in your canvas.
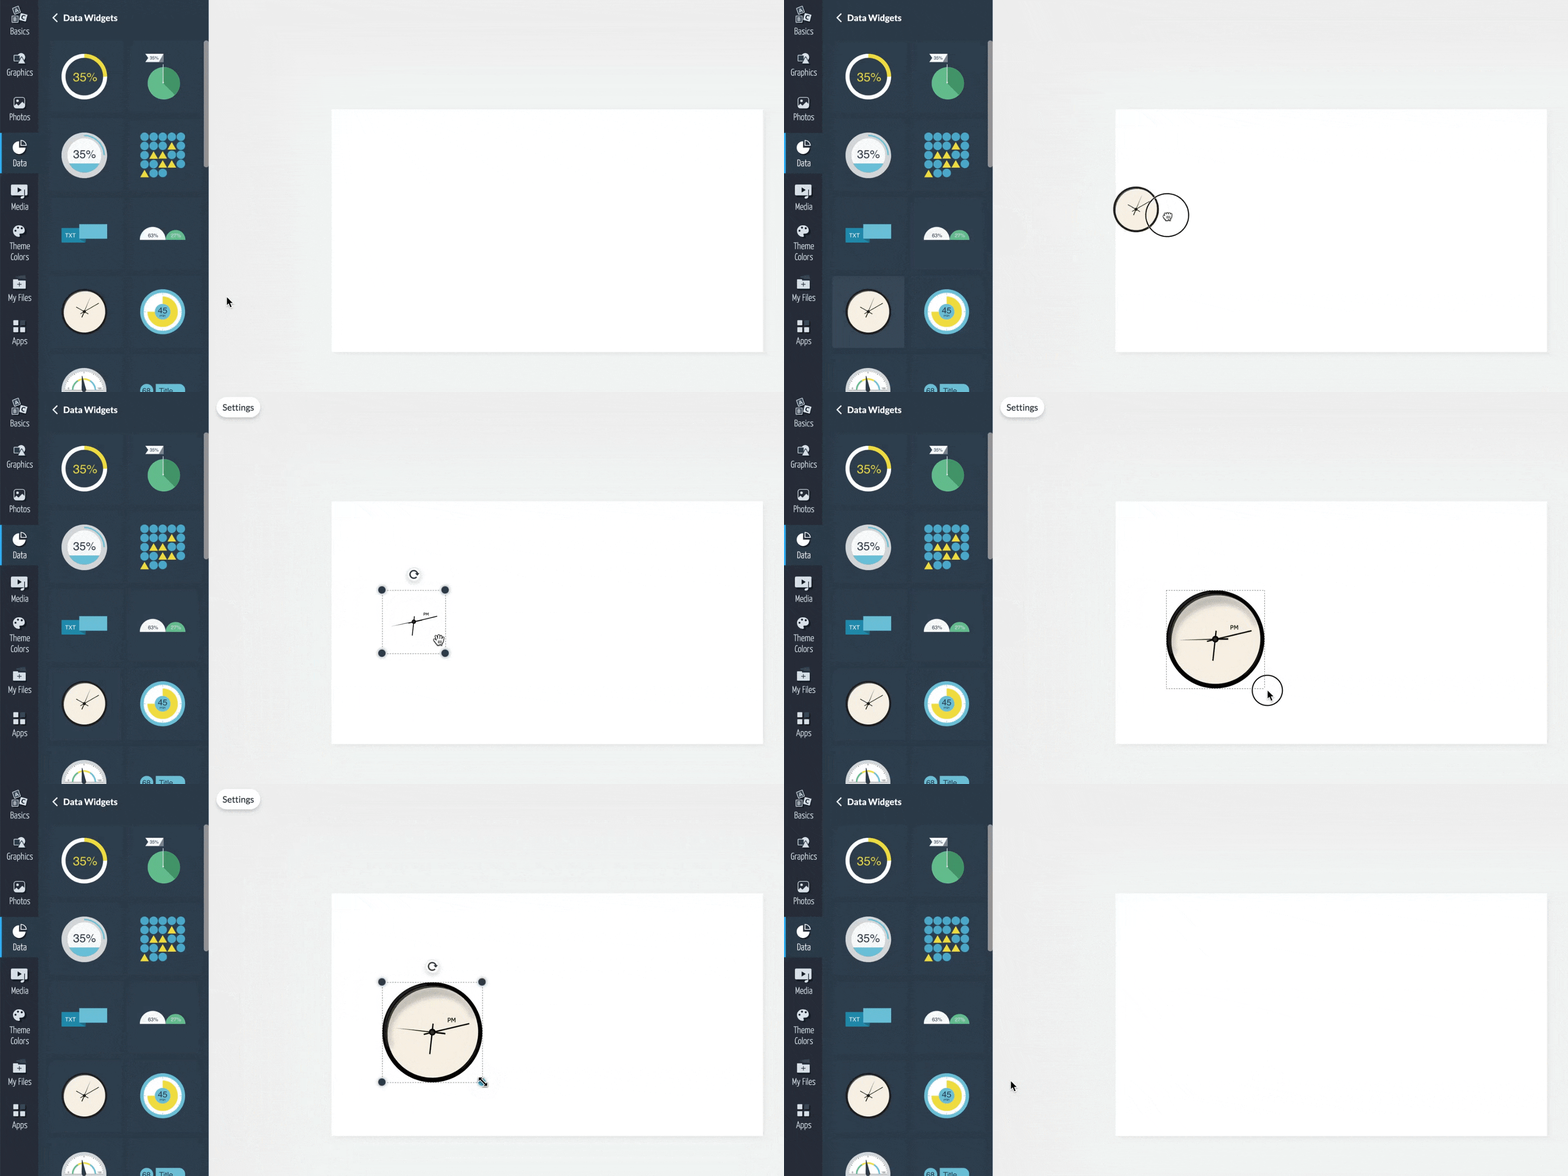
2
You can customize the widget by selecting it and modifying the Settings on the left side of the top menu. From there, you will be able to customize the appearance of the clock by choosing between a minimalist analog clock with no numbers or lines, a more elaborate analog clock with numbers, minutes, and seconds, or a digital clock with seconds and minutes.
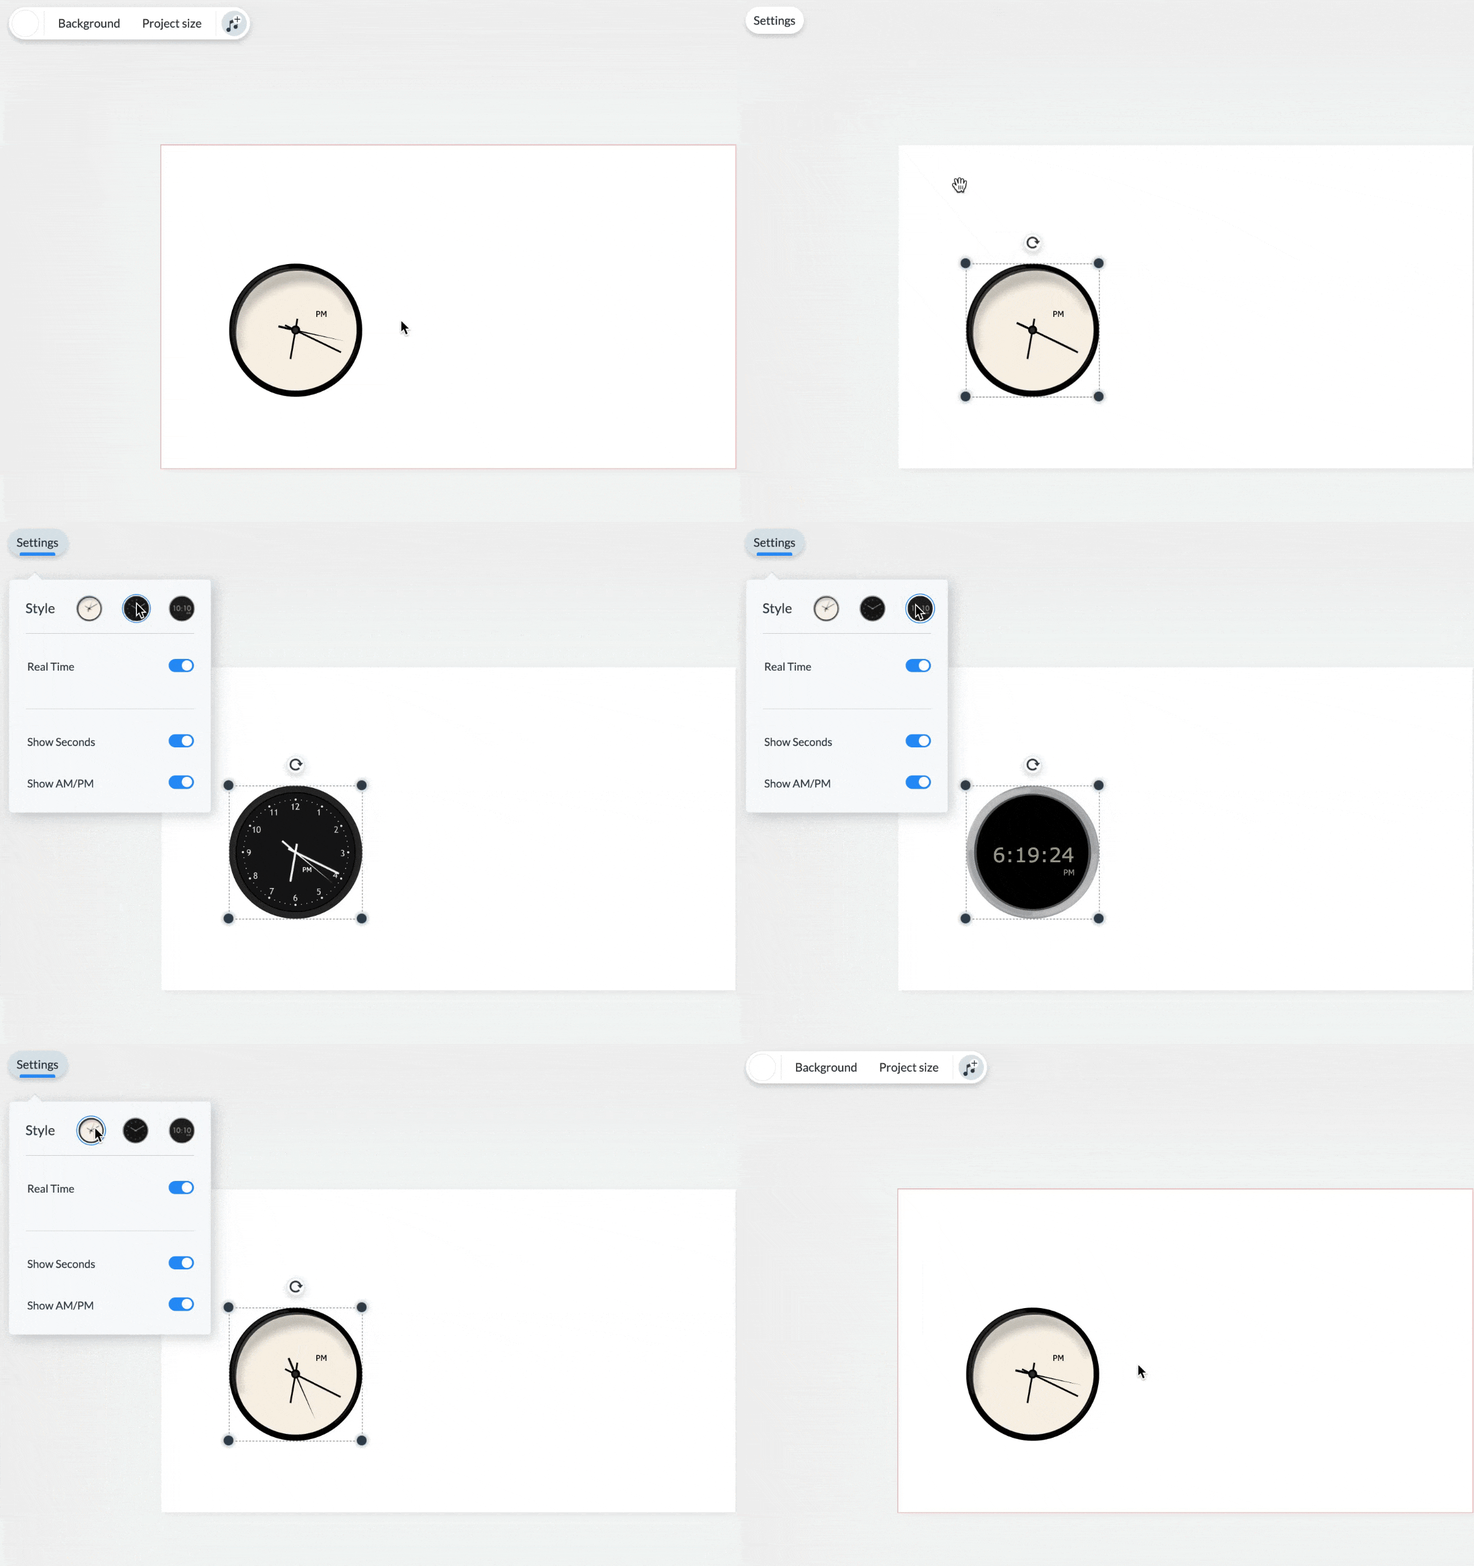
3
You can choose to display the actual hour by turning the Real Time switch ON. If you want to display a specific hour, turn the switch OFF and enter the desired time. You can also choose to Show Seconds and Show AM/PM or choose to not show it.
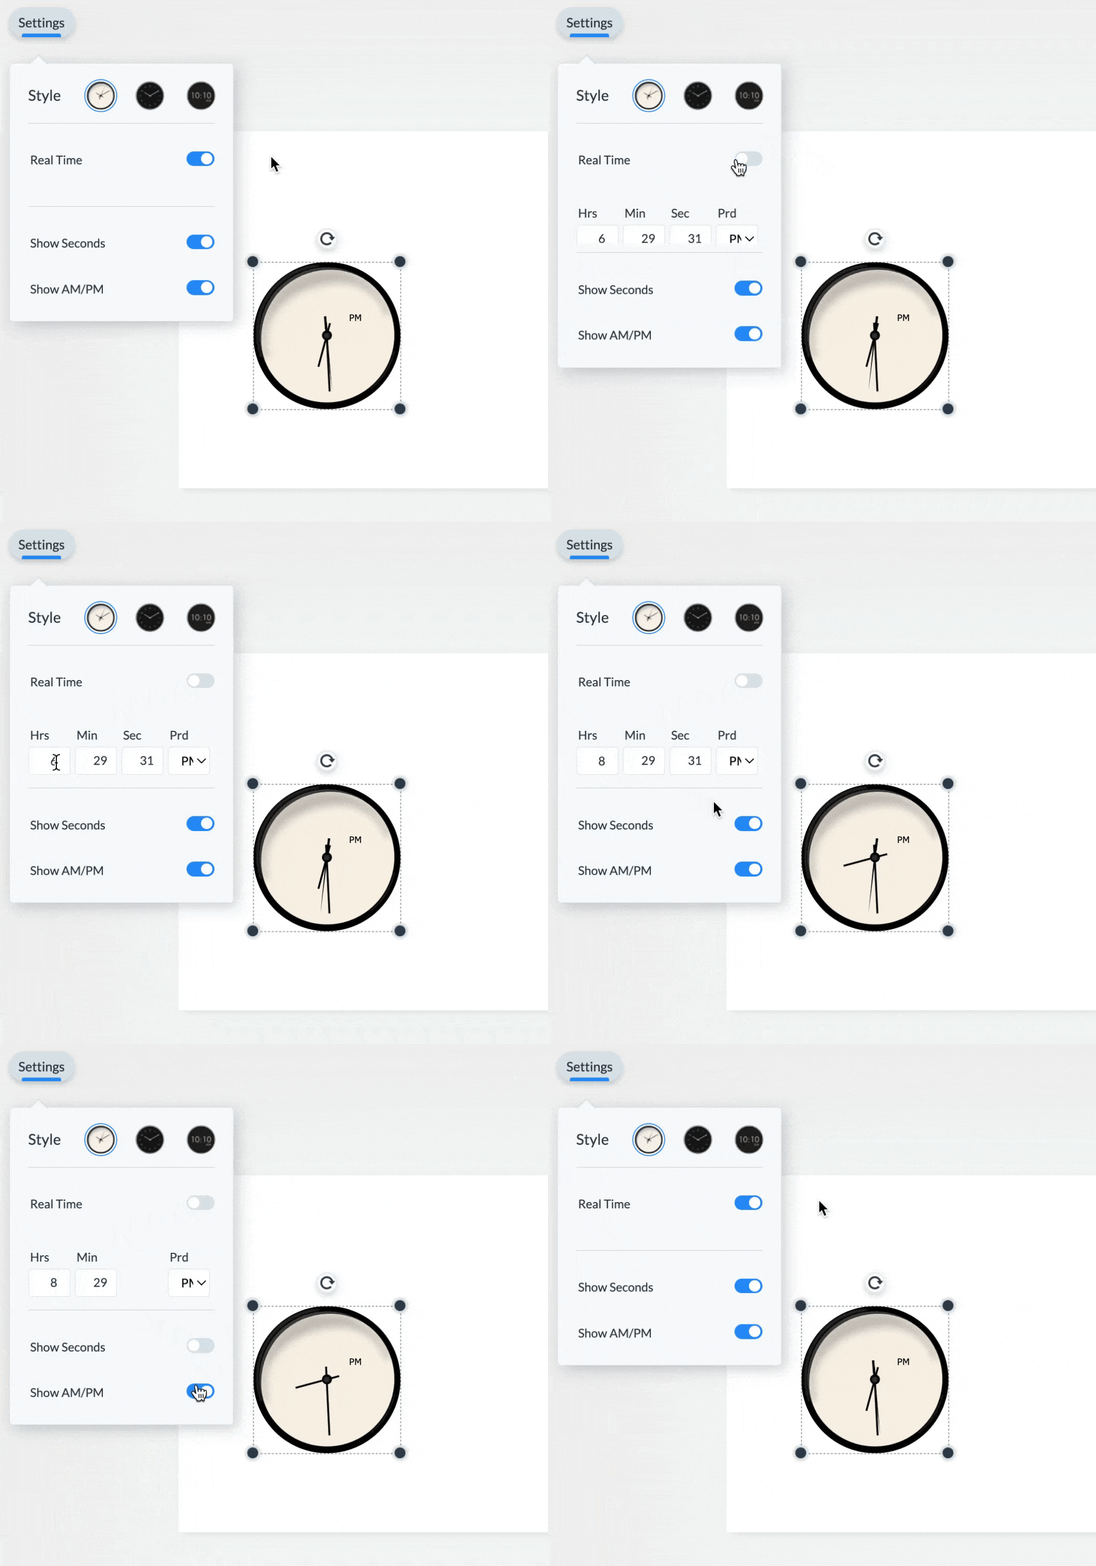
Note: The Real-Time option will display your PC’s time. If you want to change the time zone, first change your PC’s date and time settings.
Population Arrays
The population arrays allow you to translate statistics into visual representations using a collection of of objects, pictures, or numbers in rows.
1
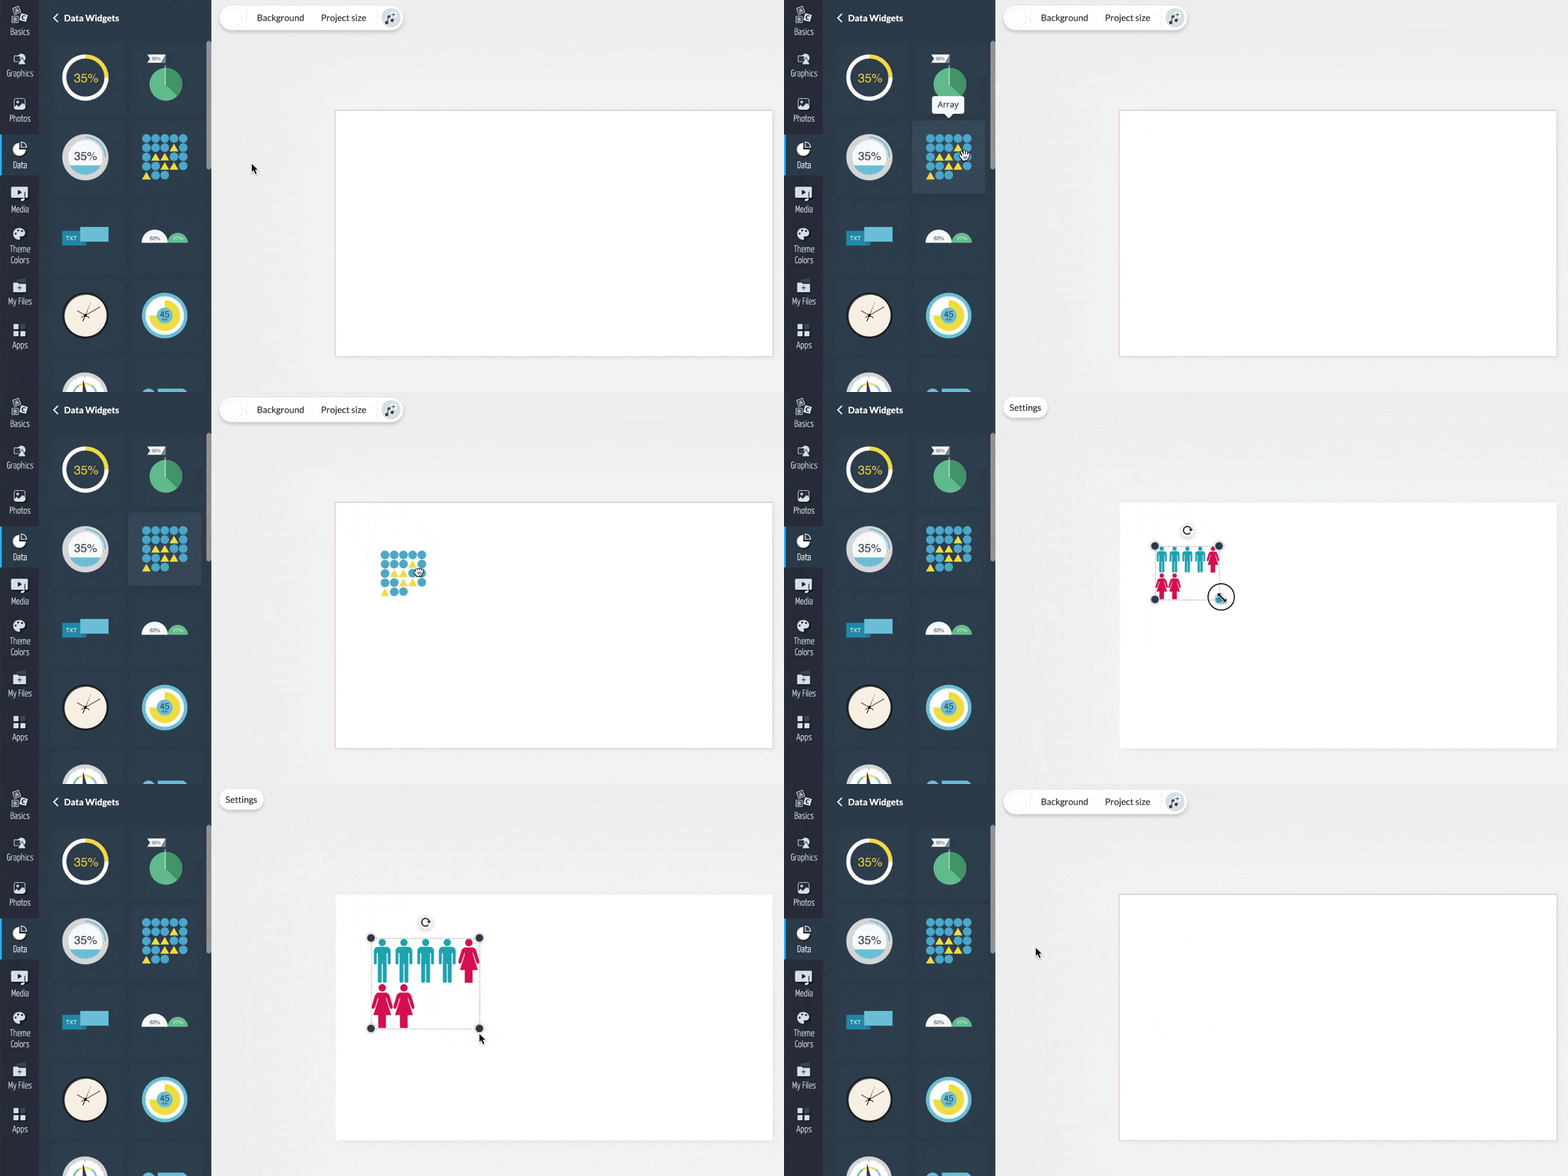
From the Data Widgets section, select Array and place it in your project by simply clicking on it or dragging and dropping it into place.
2
Select the array and navigate to the Settings tab at the top left corner. From there, you will be able to customize the Icons, Colors, icons Order, and the number of icons Per Row.
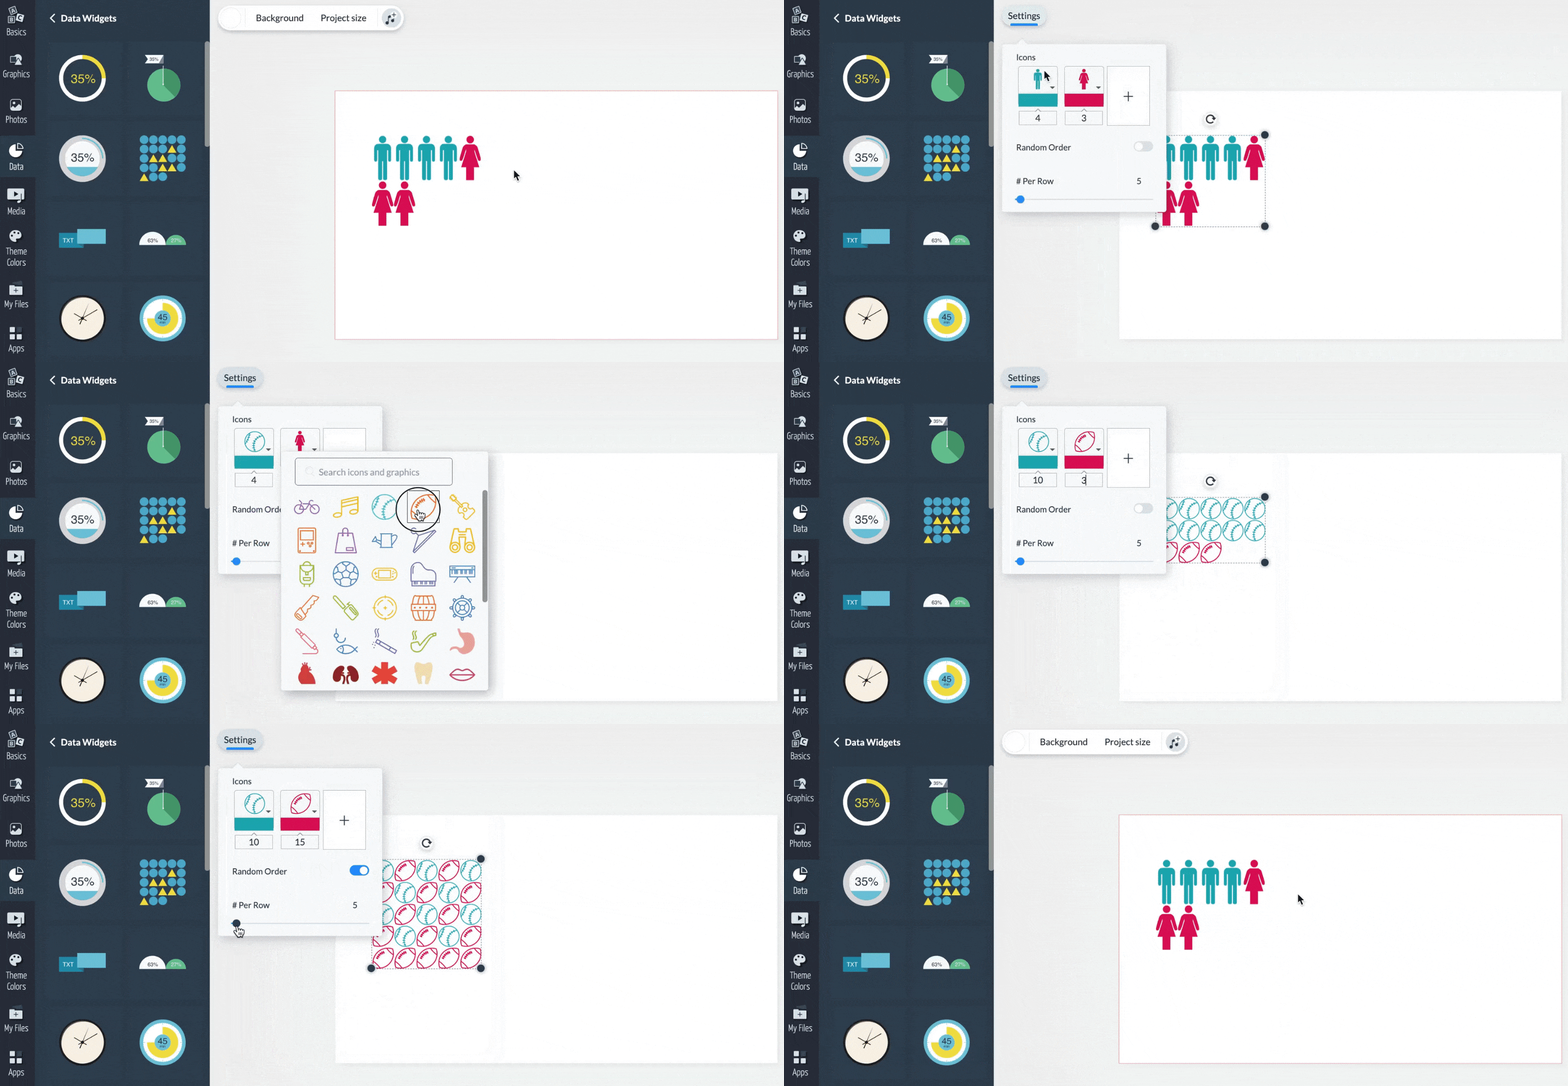
Note: Looking to know more about how to customize population arrays? Learn more
here. Counter
The counter widget is great for viewer interactivity. Educators, trainers, speakers, and presenters will find this feature incredibly useful for both standalone slide decks and live presentations.
Tip: If you’re under a strict time limit for your presentation, you can use these widgets to rehearse each slide to practice finishing the presentation within the time constraints. Or, if you are creating training content and the amount of time the learner is on the slide is limited to a specific amount of seconds, you can use the counter to countdown the amount of time left on the slide before it progresses to the next so the learner is aware of the time limit.
1
Select any counter widget you would like to use. Once you have decided, click or drag and drop the widget in your canvas.
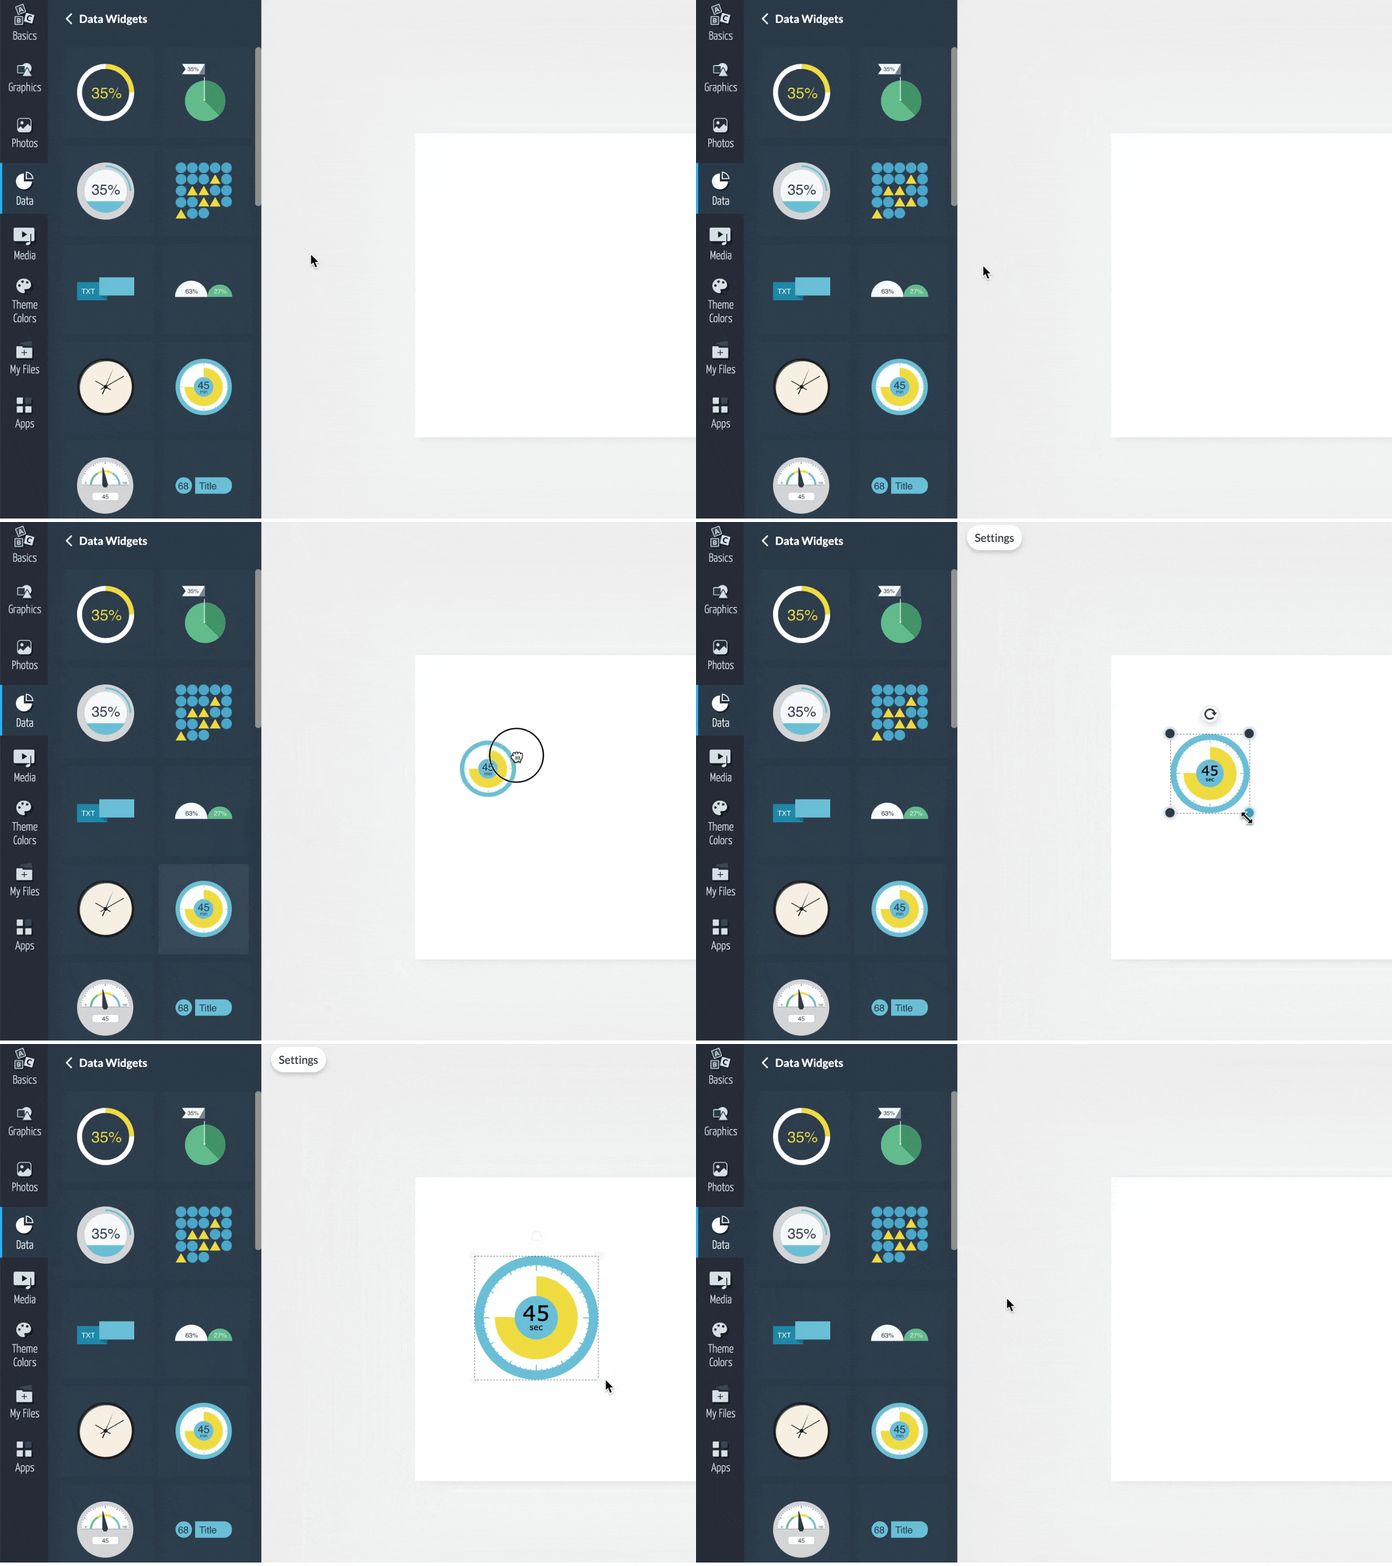
2
You can customize the widget by selecting it and modifying the Settings on the left side of the top menu. From there, you will be able to customize the appearance of the counter by choosing between three different styles.
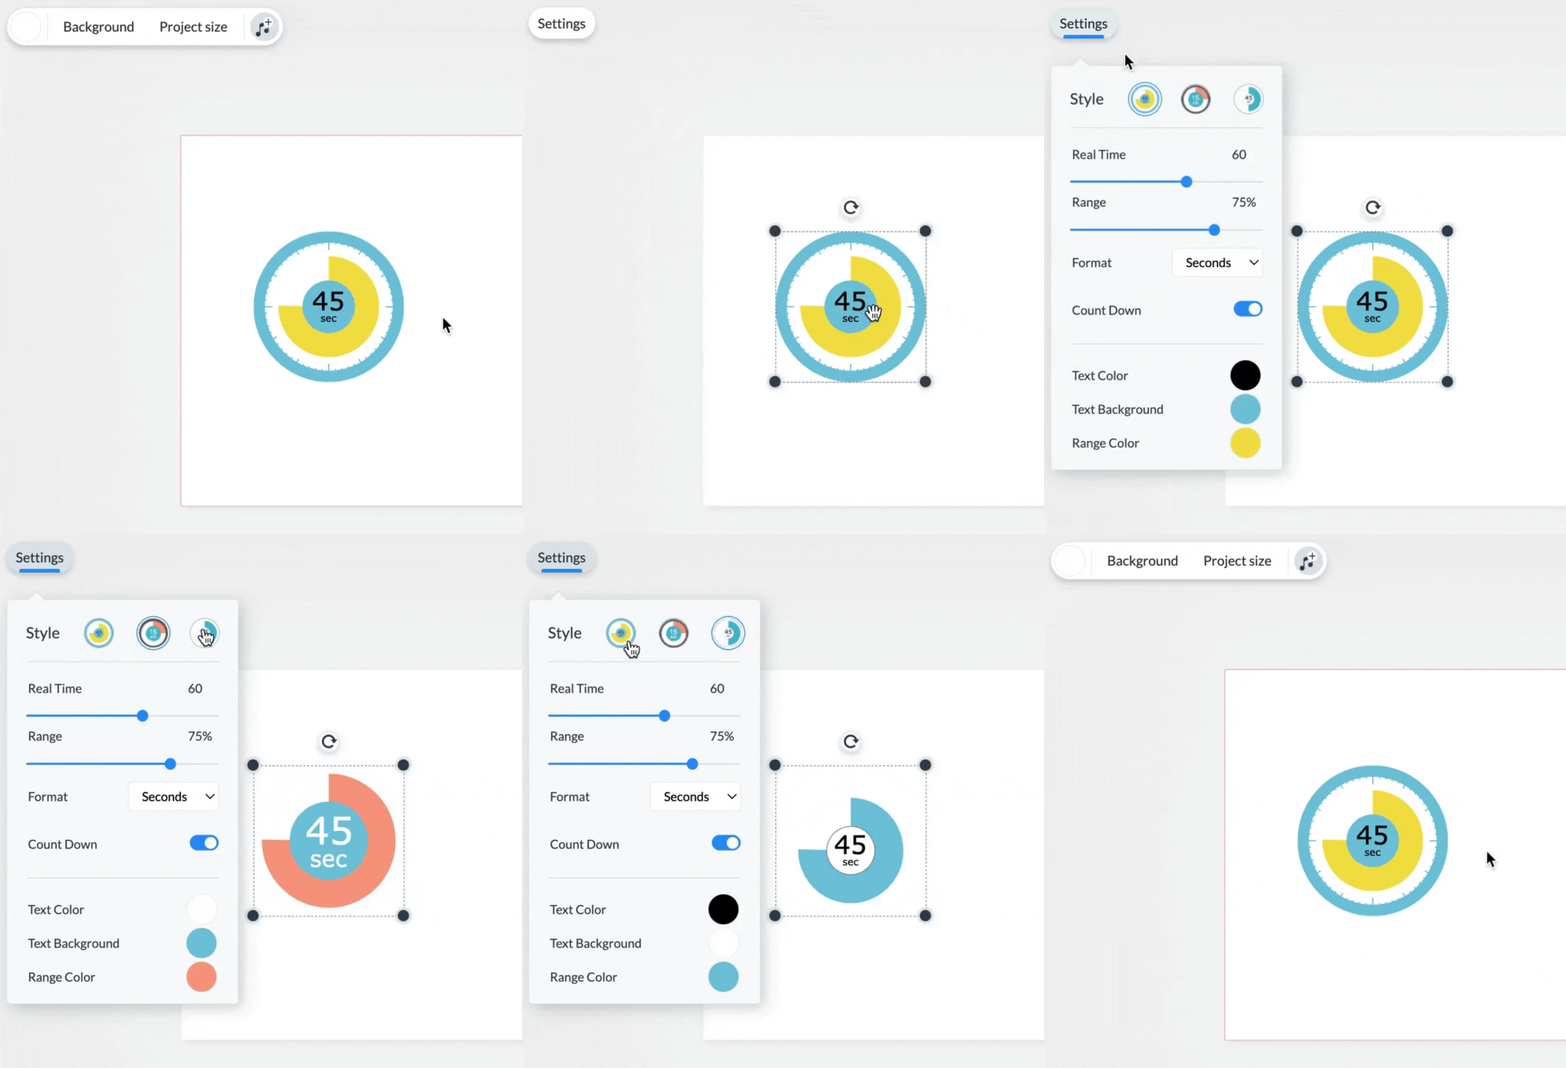
3
From there, you can also set the real-time using the Real Time slider and adjust the range of visualization using the Range slider. To customize the time format and choose between hours, minutes, and seconds, use the Format dropdown menu. If you want to use this widget as a countdown, turn the Count Down switch ON.
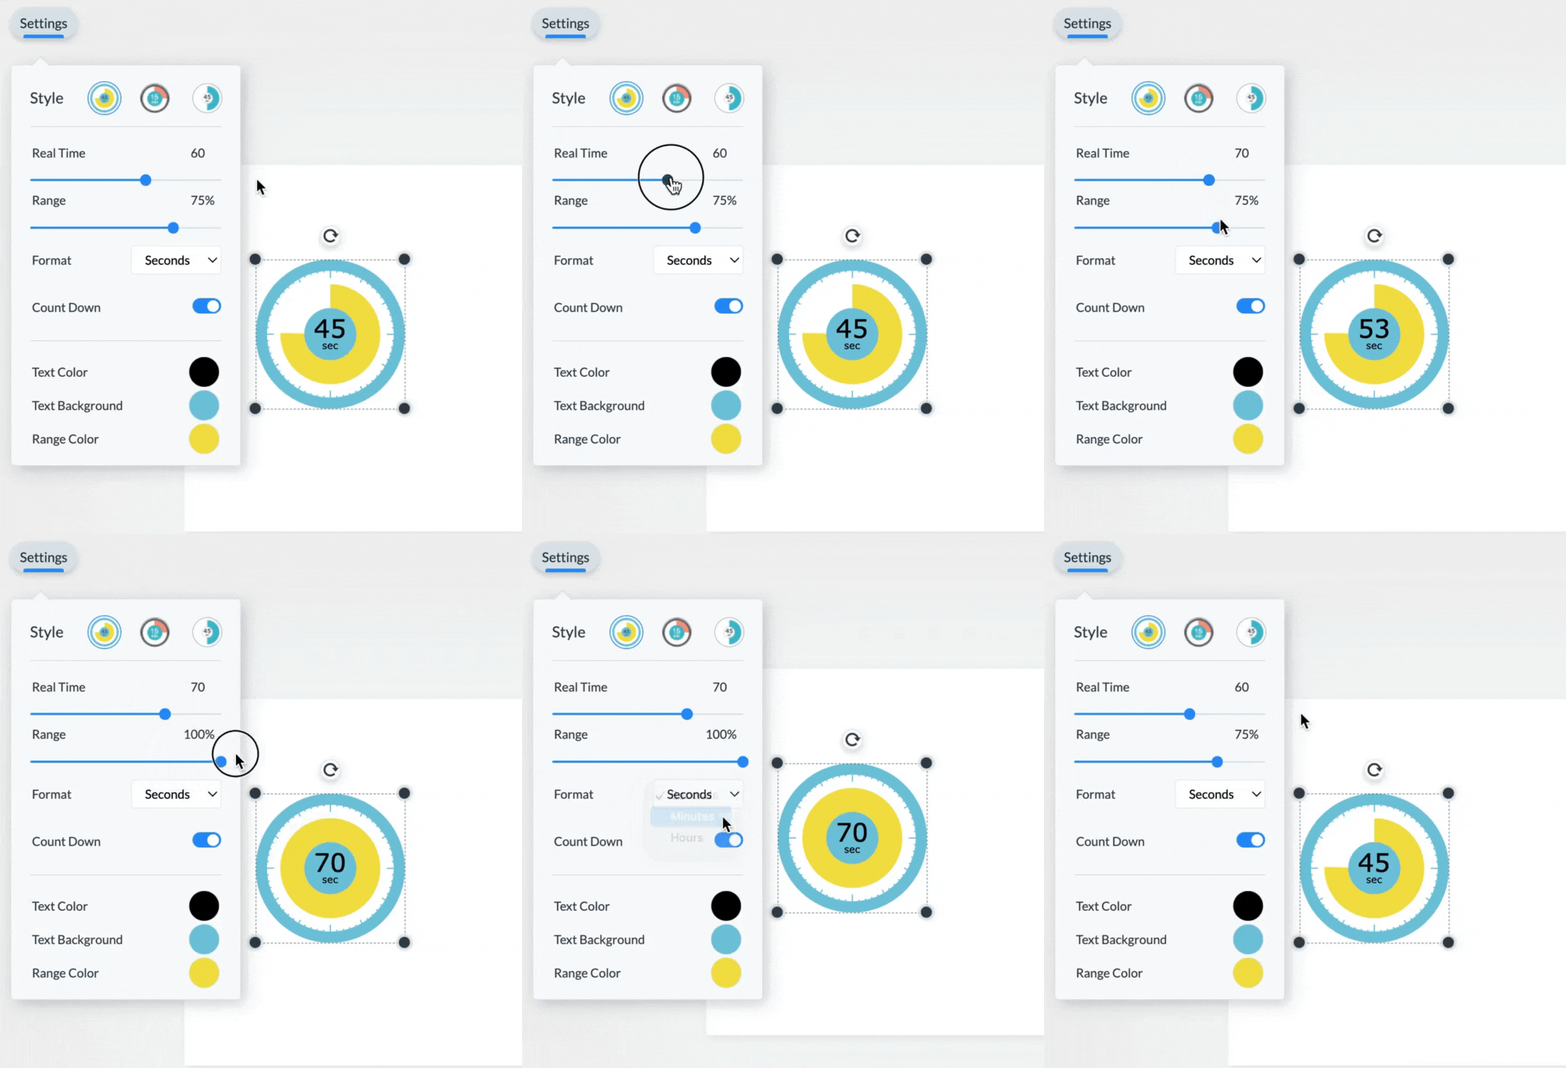
4
At the bottom of the Settings menu, you will be able to customize the Text Color, Text background, and Range Color.
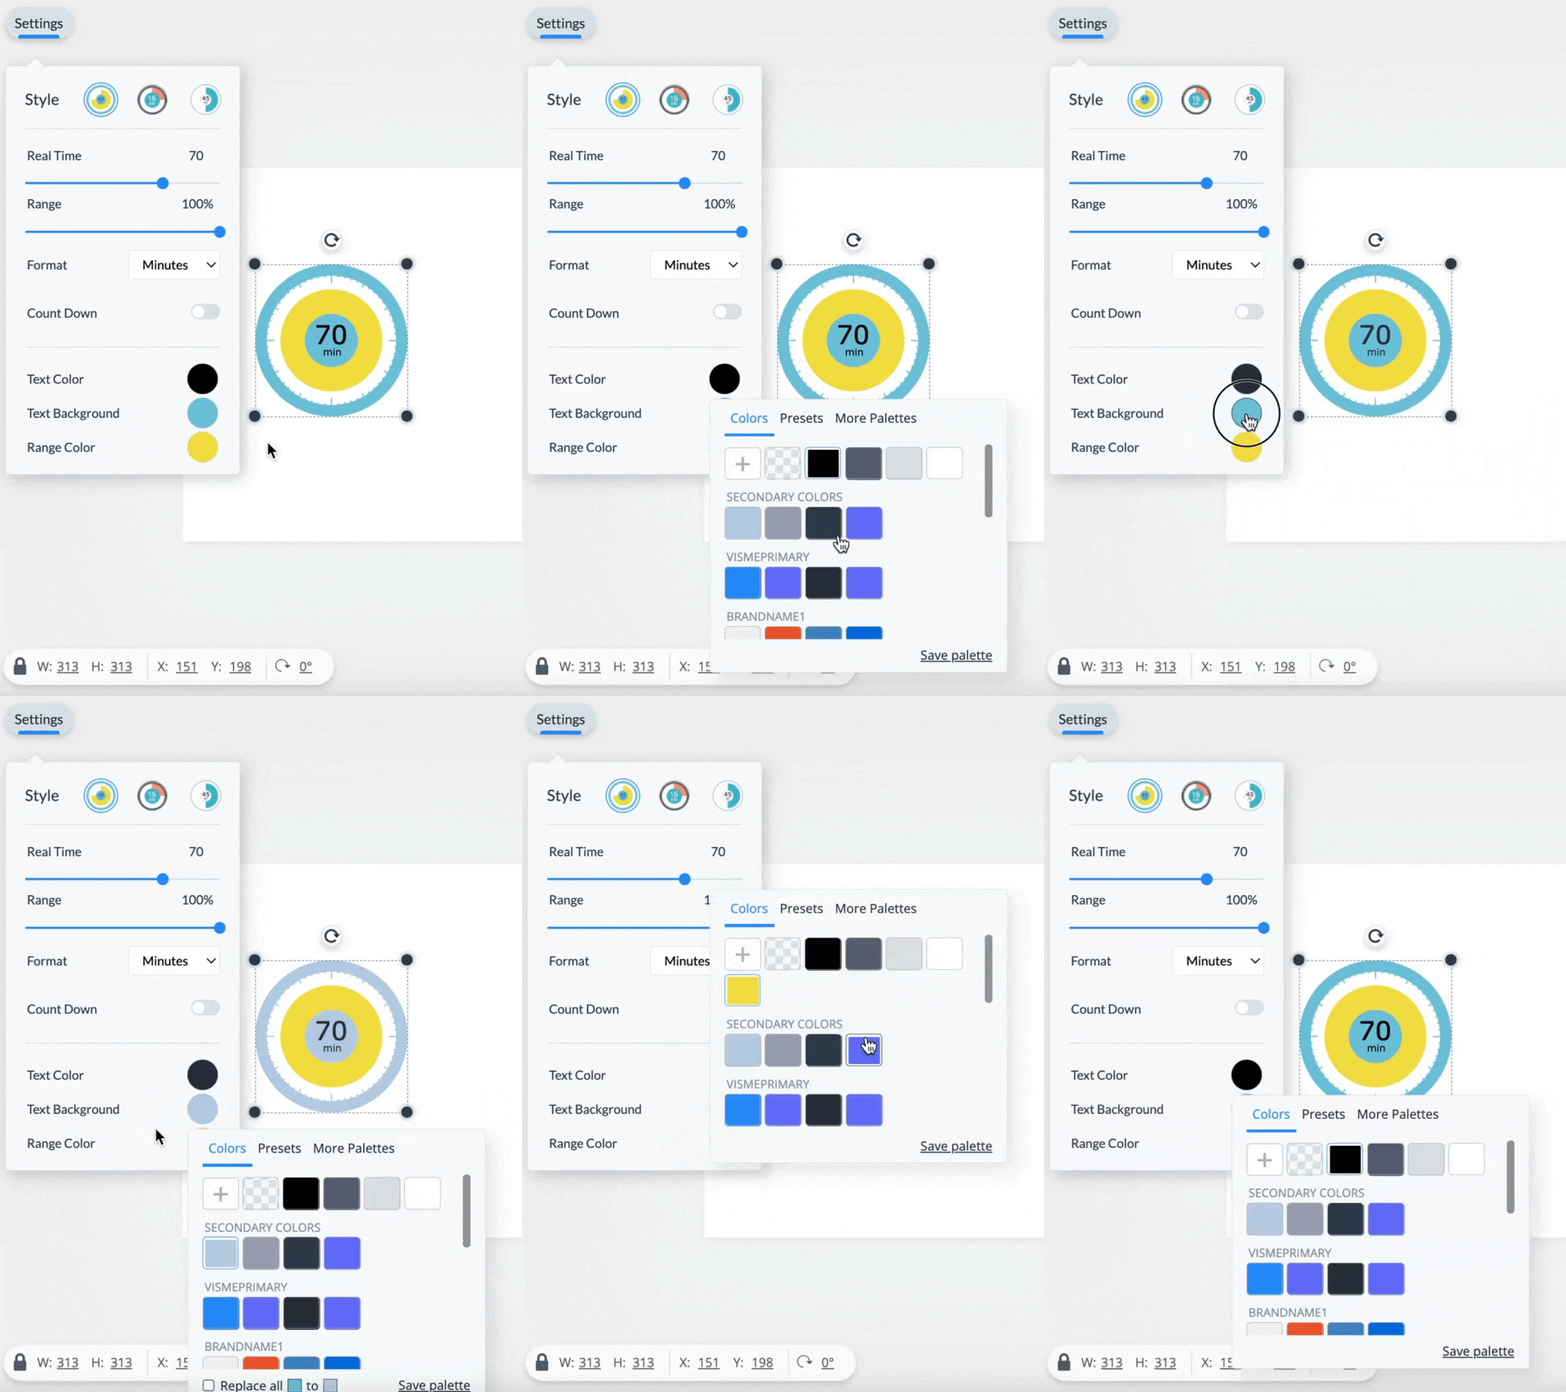
Progress
Progress widgets are another great way to visualize percentages. You can choose between different types such as coins, wheels, comparison, semi-circle, slashes, thermometers, progress bars, and more widgets.
Note: Progress bars are available in both vertical and horizontal styles.
1
Select any progress widget you would like to use. Once you have decided, click or drag and drop the widget in your canvas.
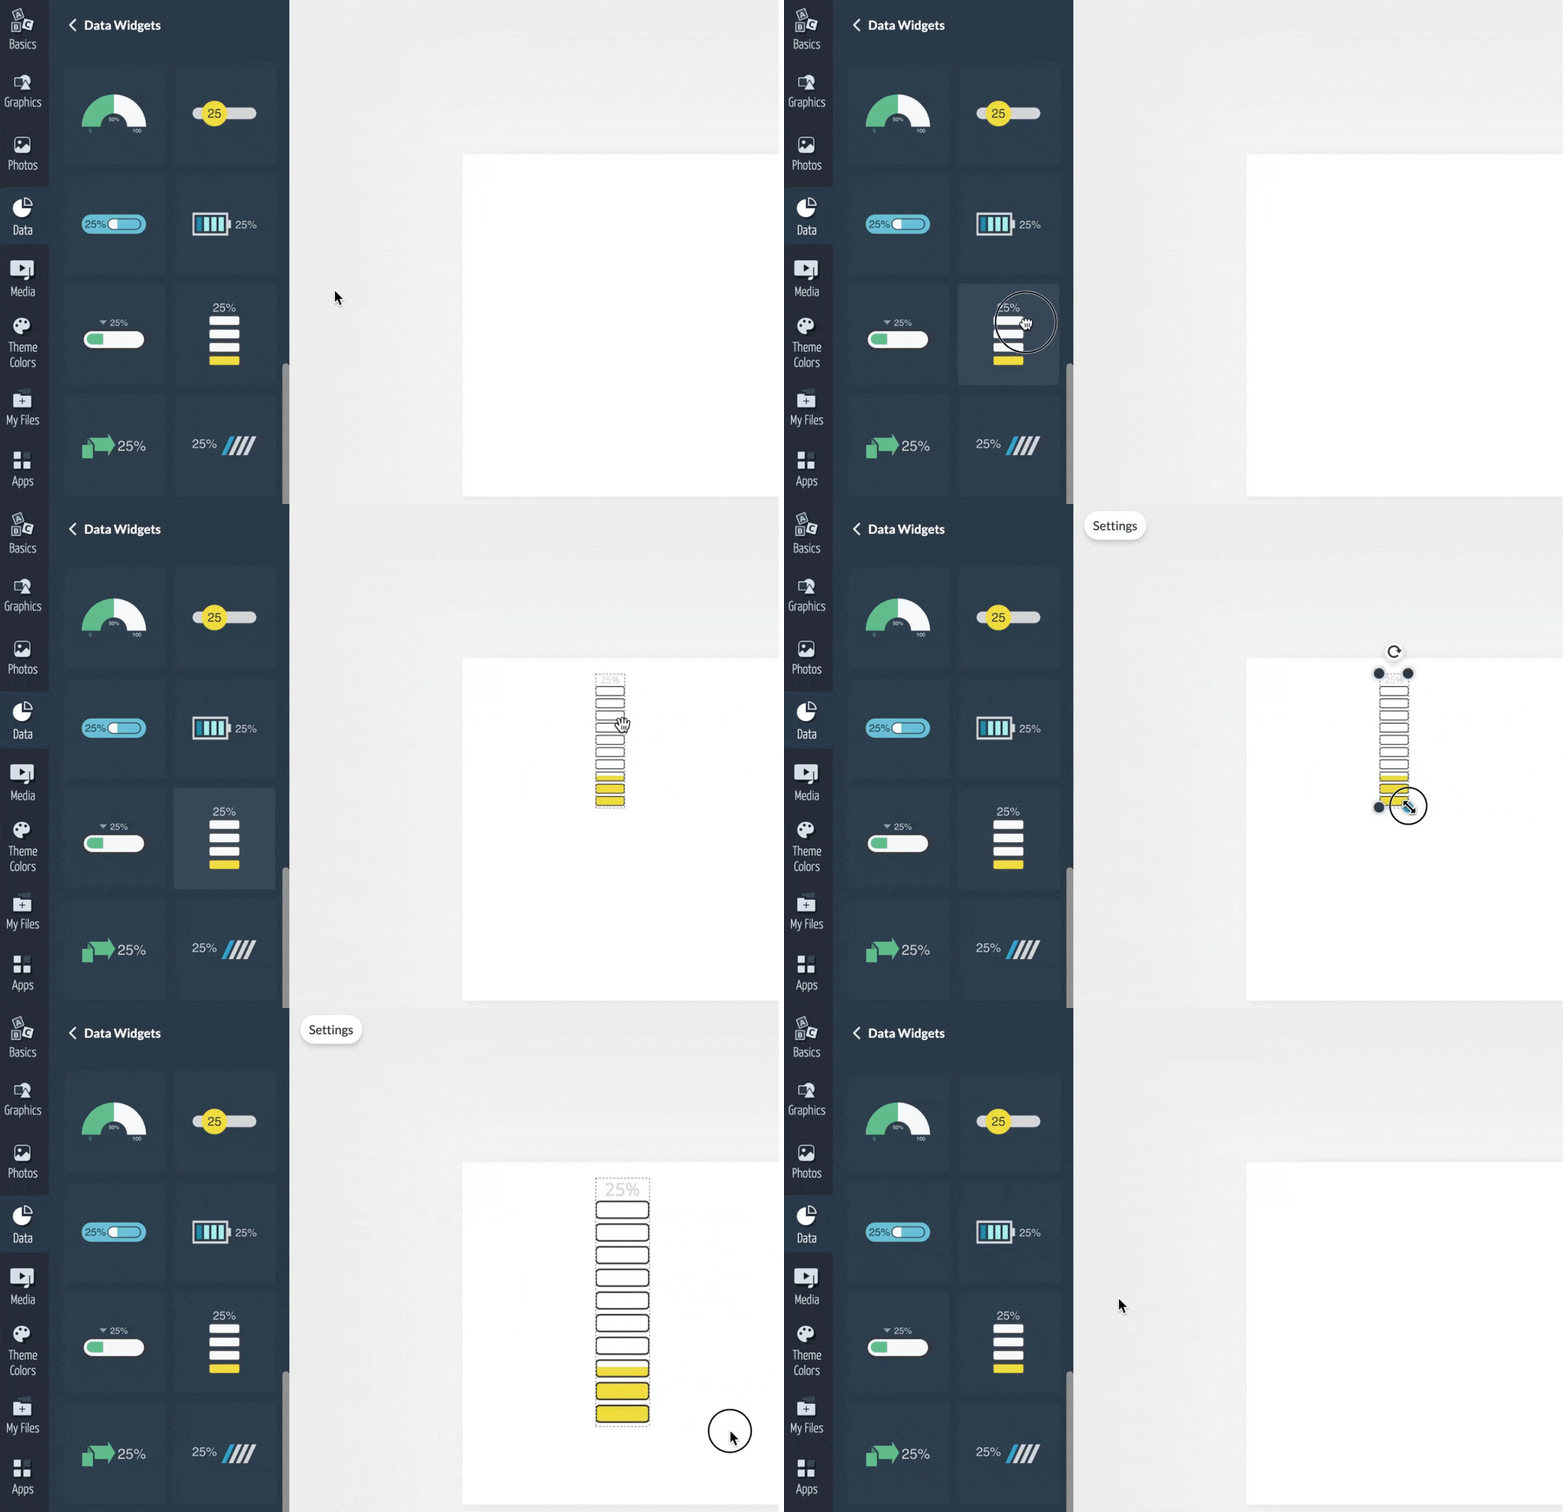
2
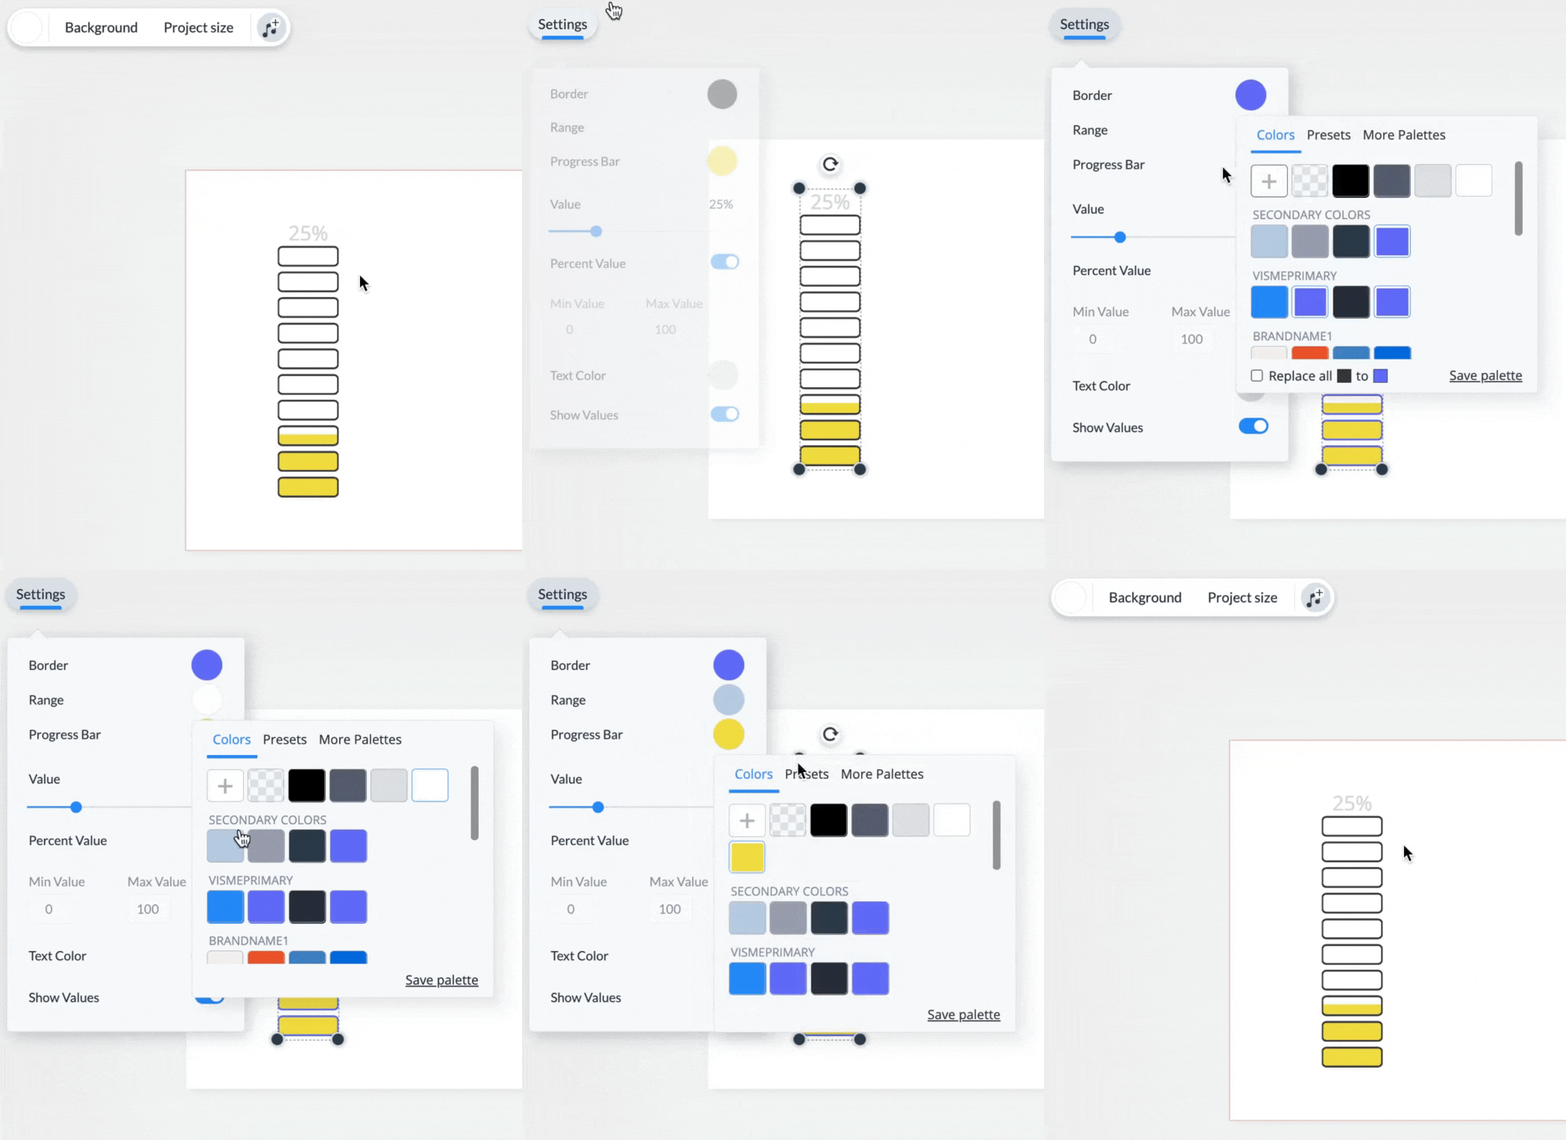
You can customize the widget by selecting it and modifying the Settings on the left side of the top menu. From there, you will be able to customize the appearance of the widget by changing the Frame, Range, and Progress colors.
3
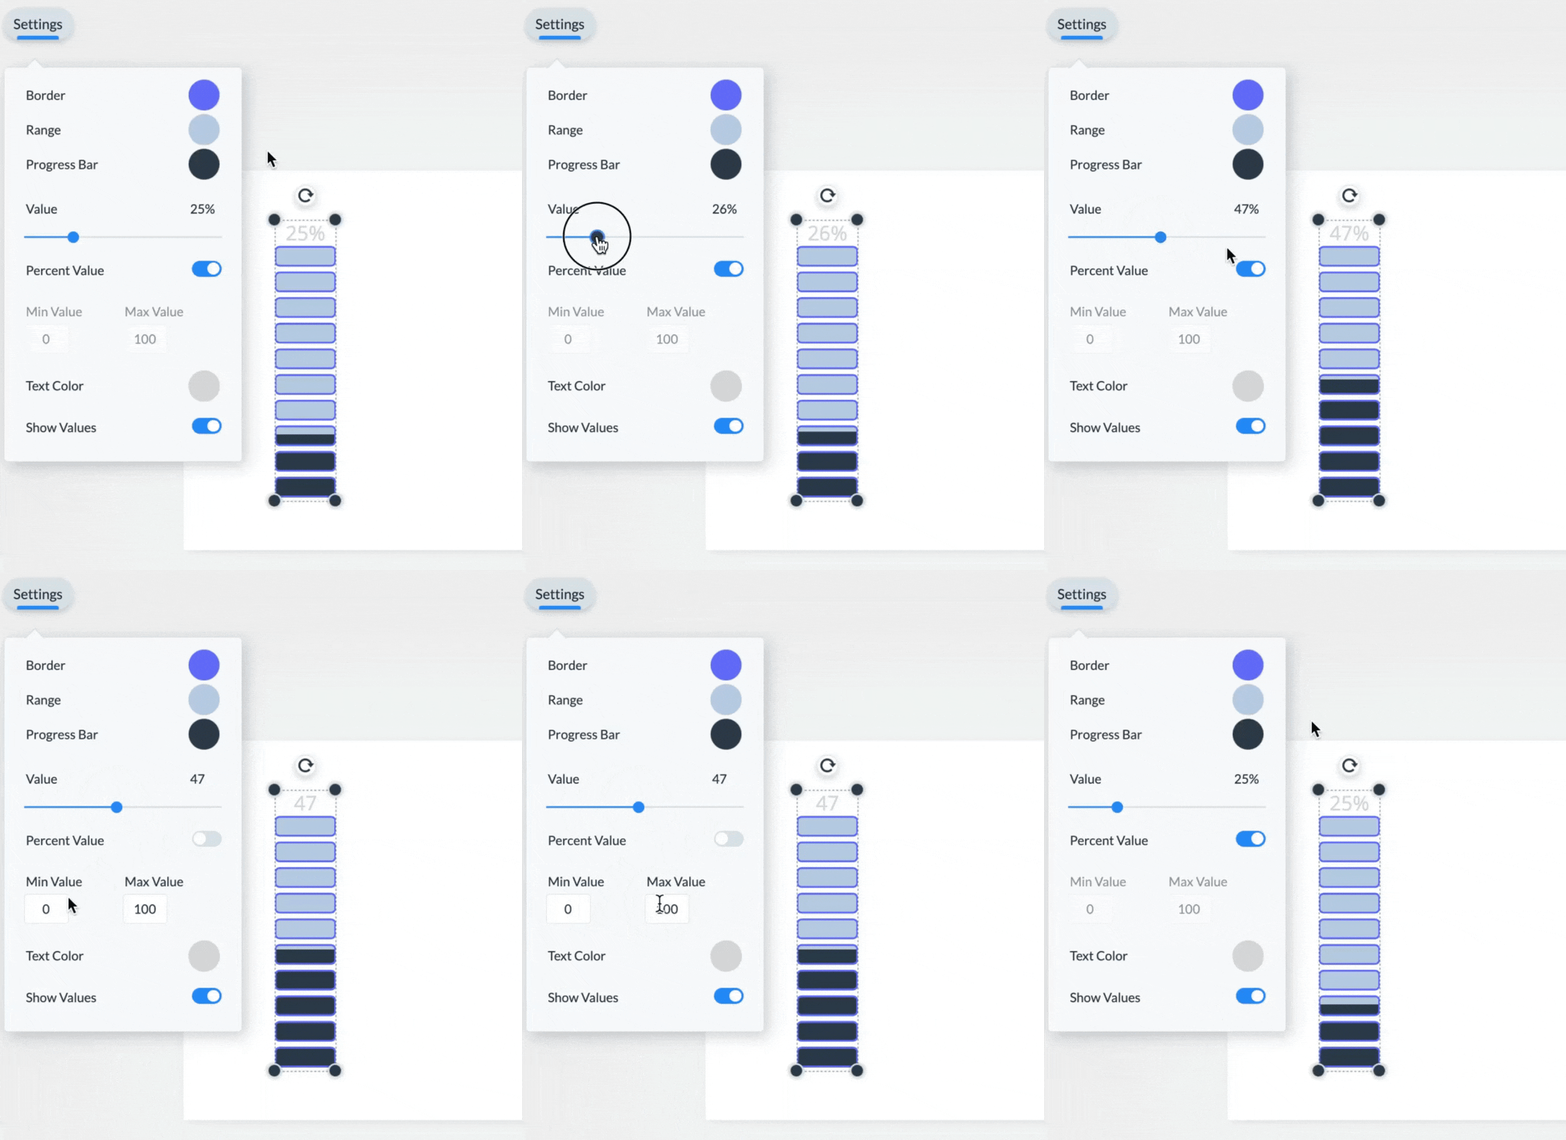
From there, you can also set the value by using the Value slider, choose whether or not to display them as a Percent Value or a whole number, enter Min and Max values for your number range, and even choose whether you want to show the value or not by turning the Show Value switch ON/OFF.
Use
3D Data Widgets to improve the engagement and impact of your content and data.
Note: Depending on the selected widget, other elements can be customized from the Settings such as ribbons or labels.
Need to visualize larger sets of data? Our data widgets are perfect for stats and figures, but for larger sets of data,style, we have over
20+ charts and graphs, and even
maps to choose from.


