Using Visme to visualize your data is a great way to have your information stand out, spark conversation, drive actions and decisions, and inform your audiences of key metrics and insights. Visme’s chart and graphs have powerful customization settings you can use to adapt the appearance, axis, legend, values, and more. Here’s how you can level your data using chart and graph settings in Visme:
1
Select the
Graph or Chart you want to customize and the
Chart Menu will appear on the left by default. From there, access the
Settings tab.
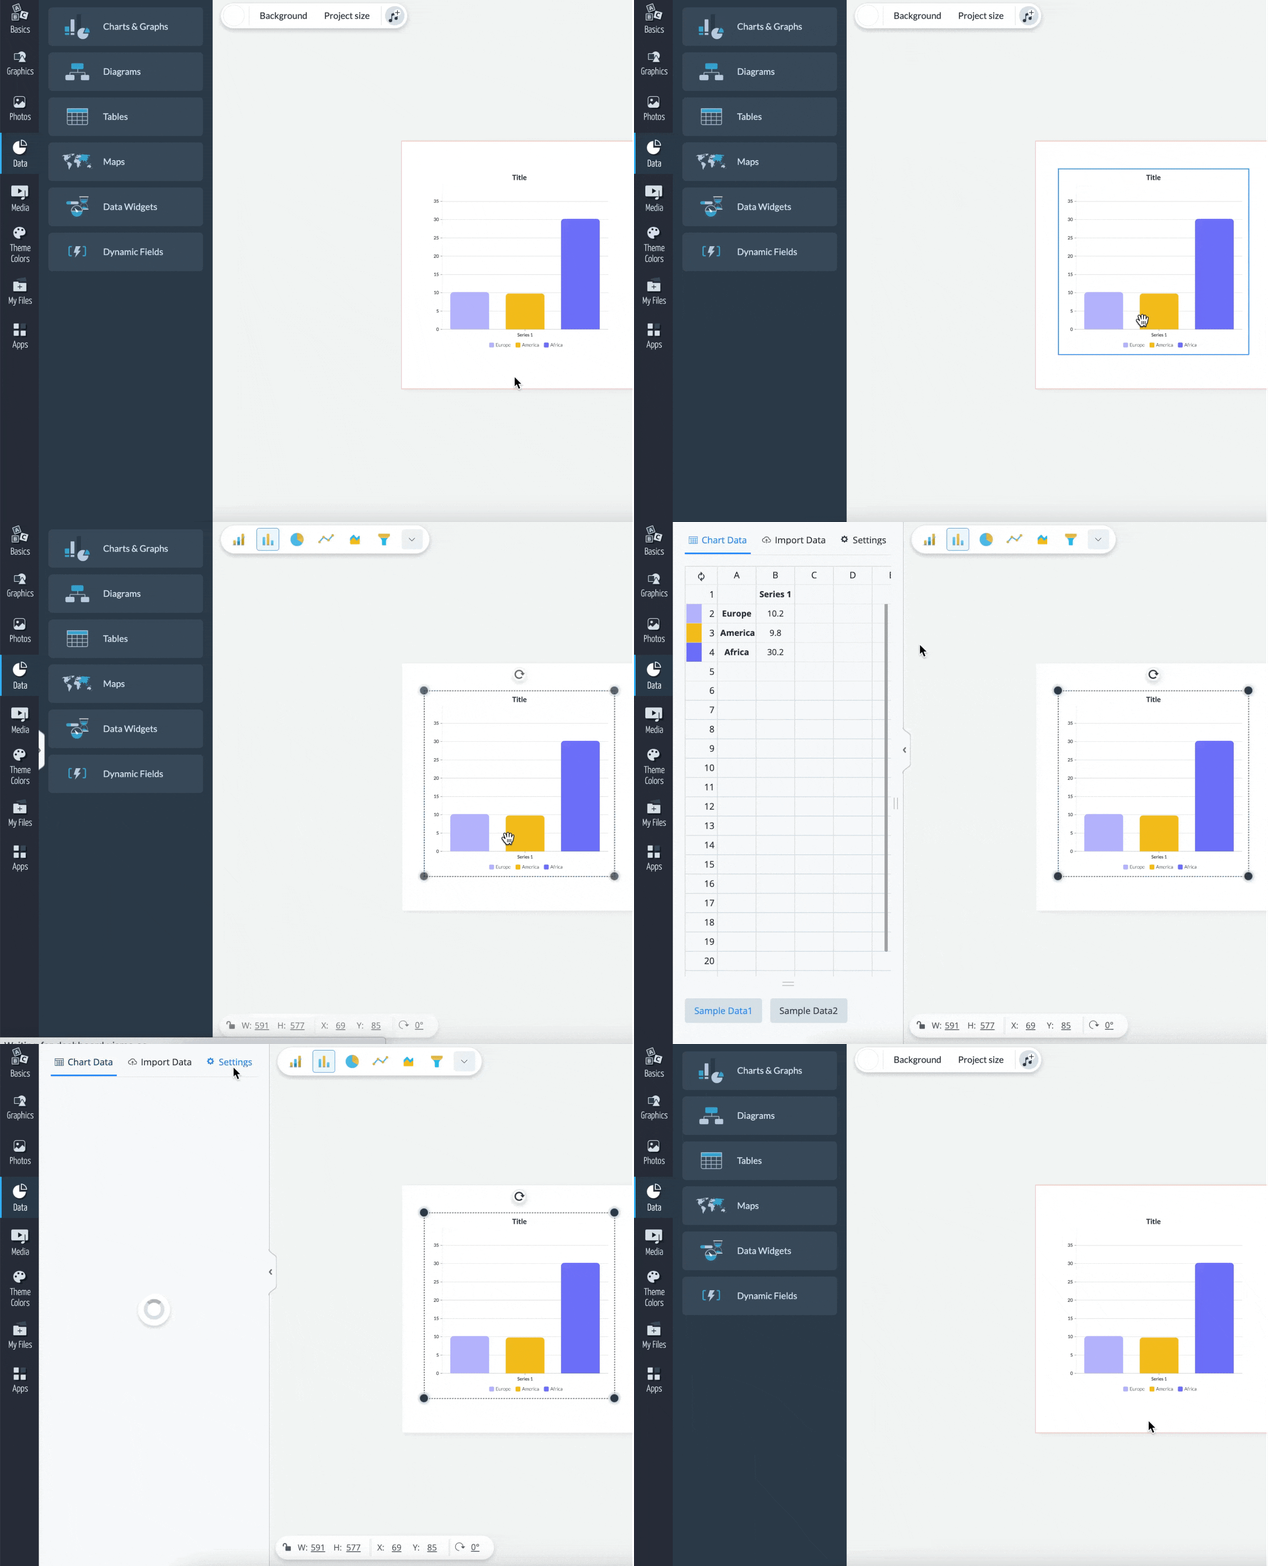
Heading
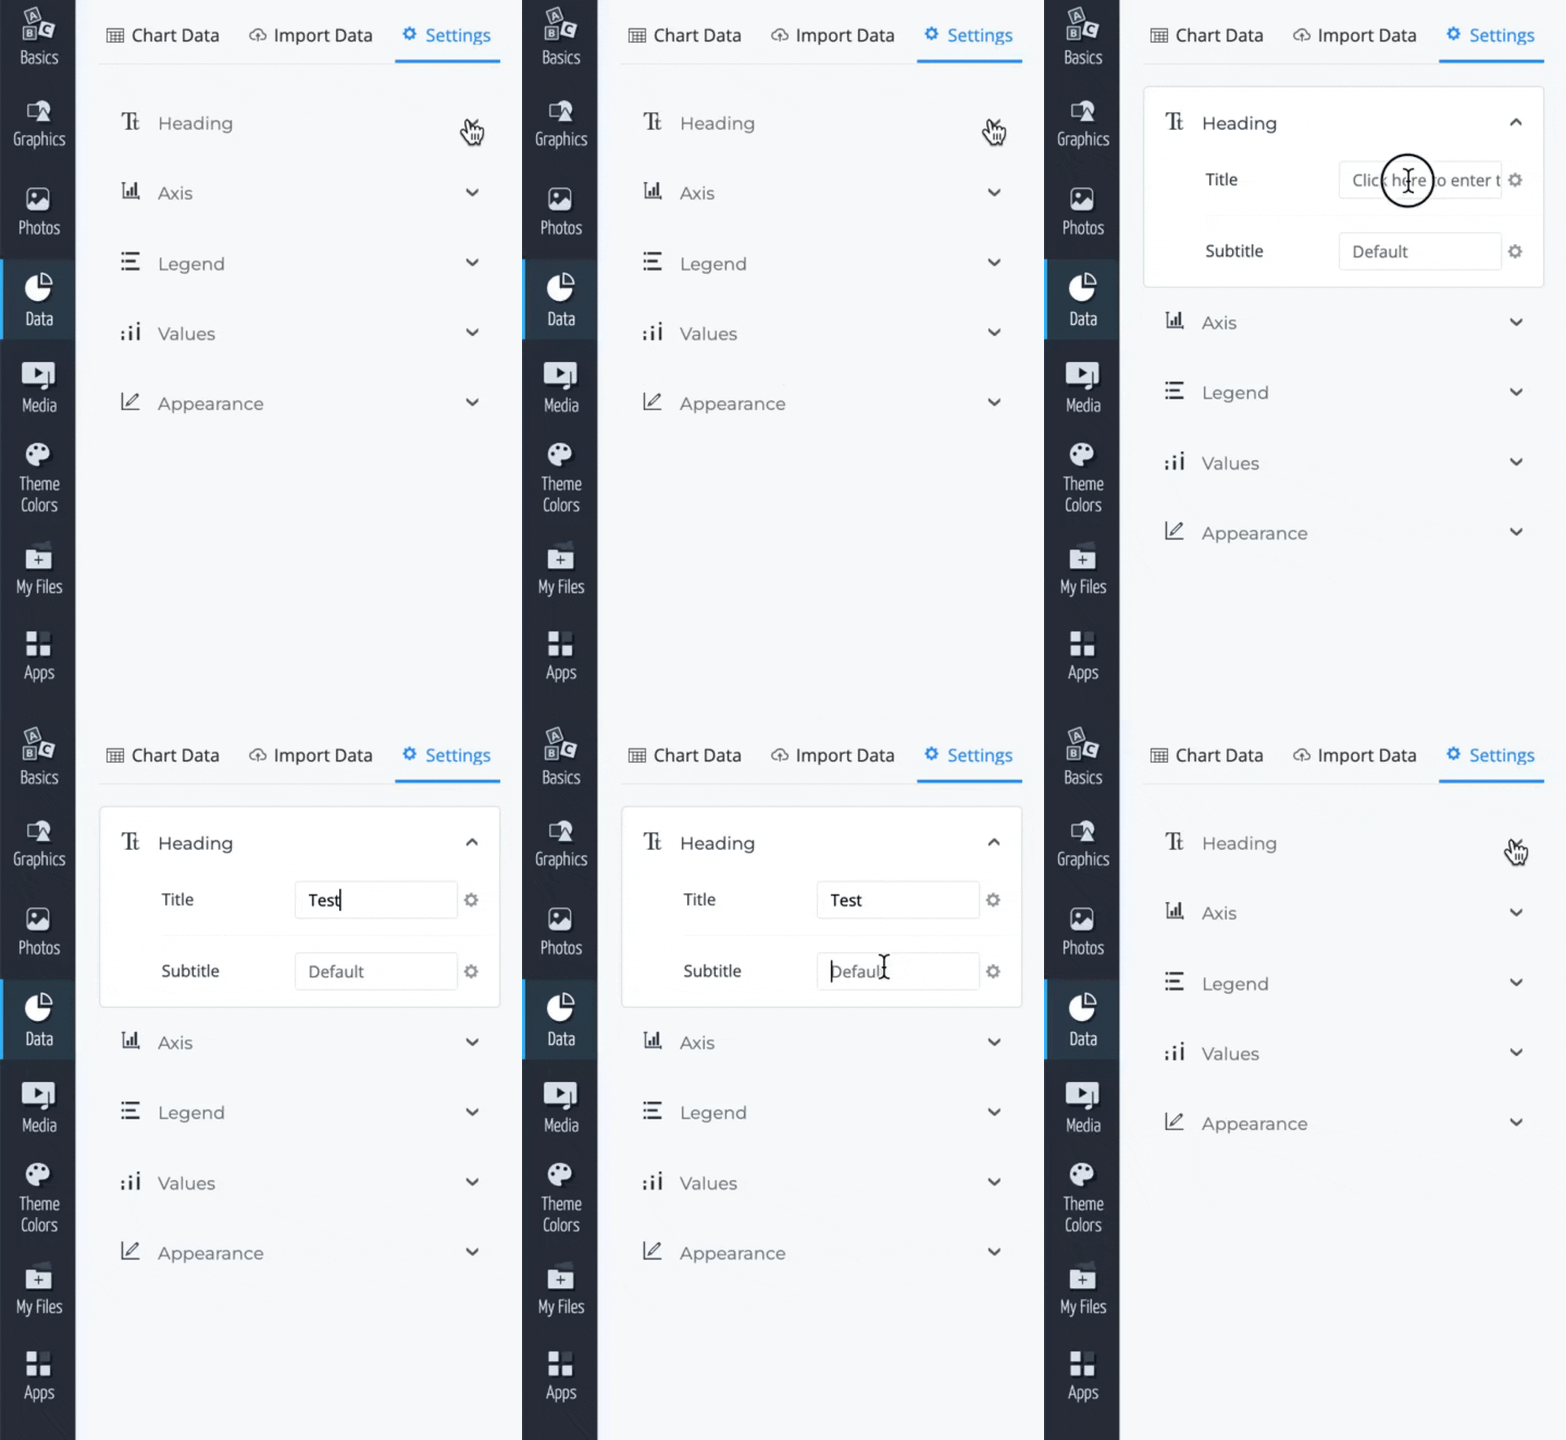
Under the Heading section, you can insert a title and subtitle for your Graph or Chart and adjust the font, color, and font size.
Note: Alternatively, you can create your stylized titles and place them wherever you like on your project using Visme’s text tool.
1
From the Heading section, give your Graph or Chart a Title and a Subtitle by adding them to the text boxes.
2
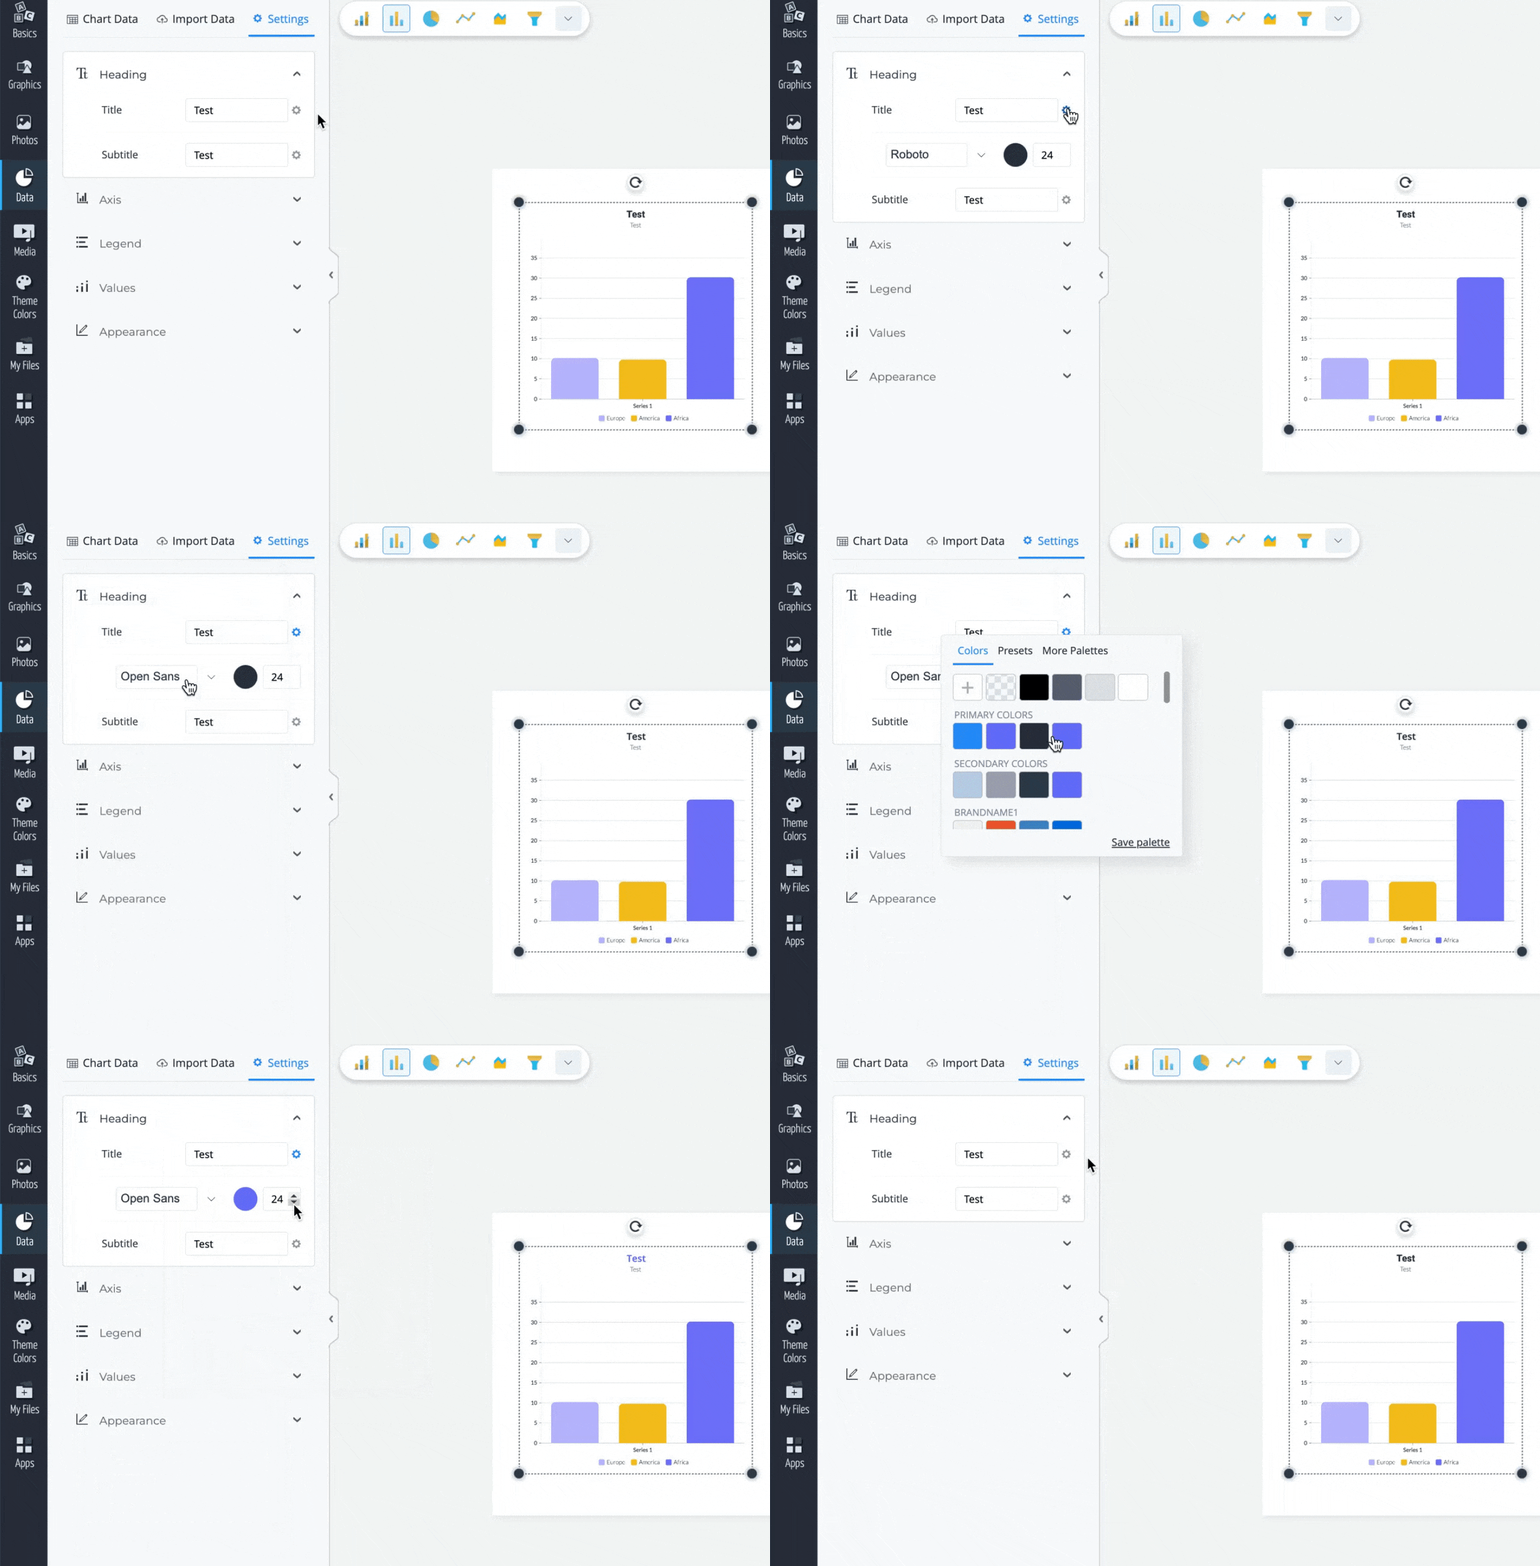
Click on the Gear Icon to customize the font, color, and point size of the Title and Subtitle of your Graph or Chart.
Axis
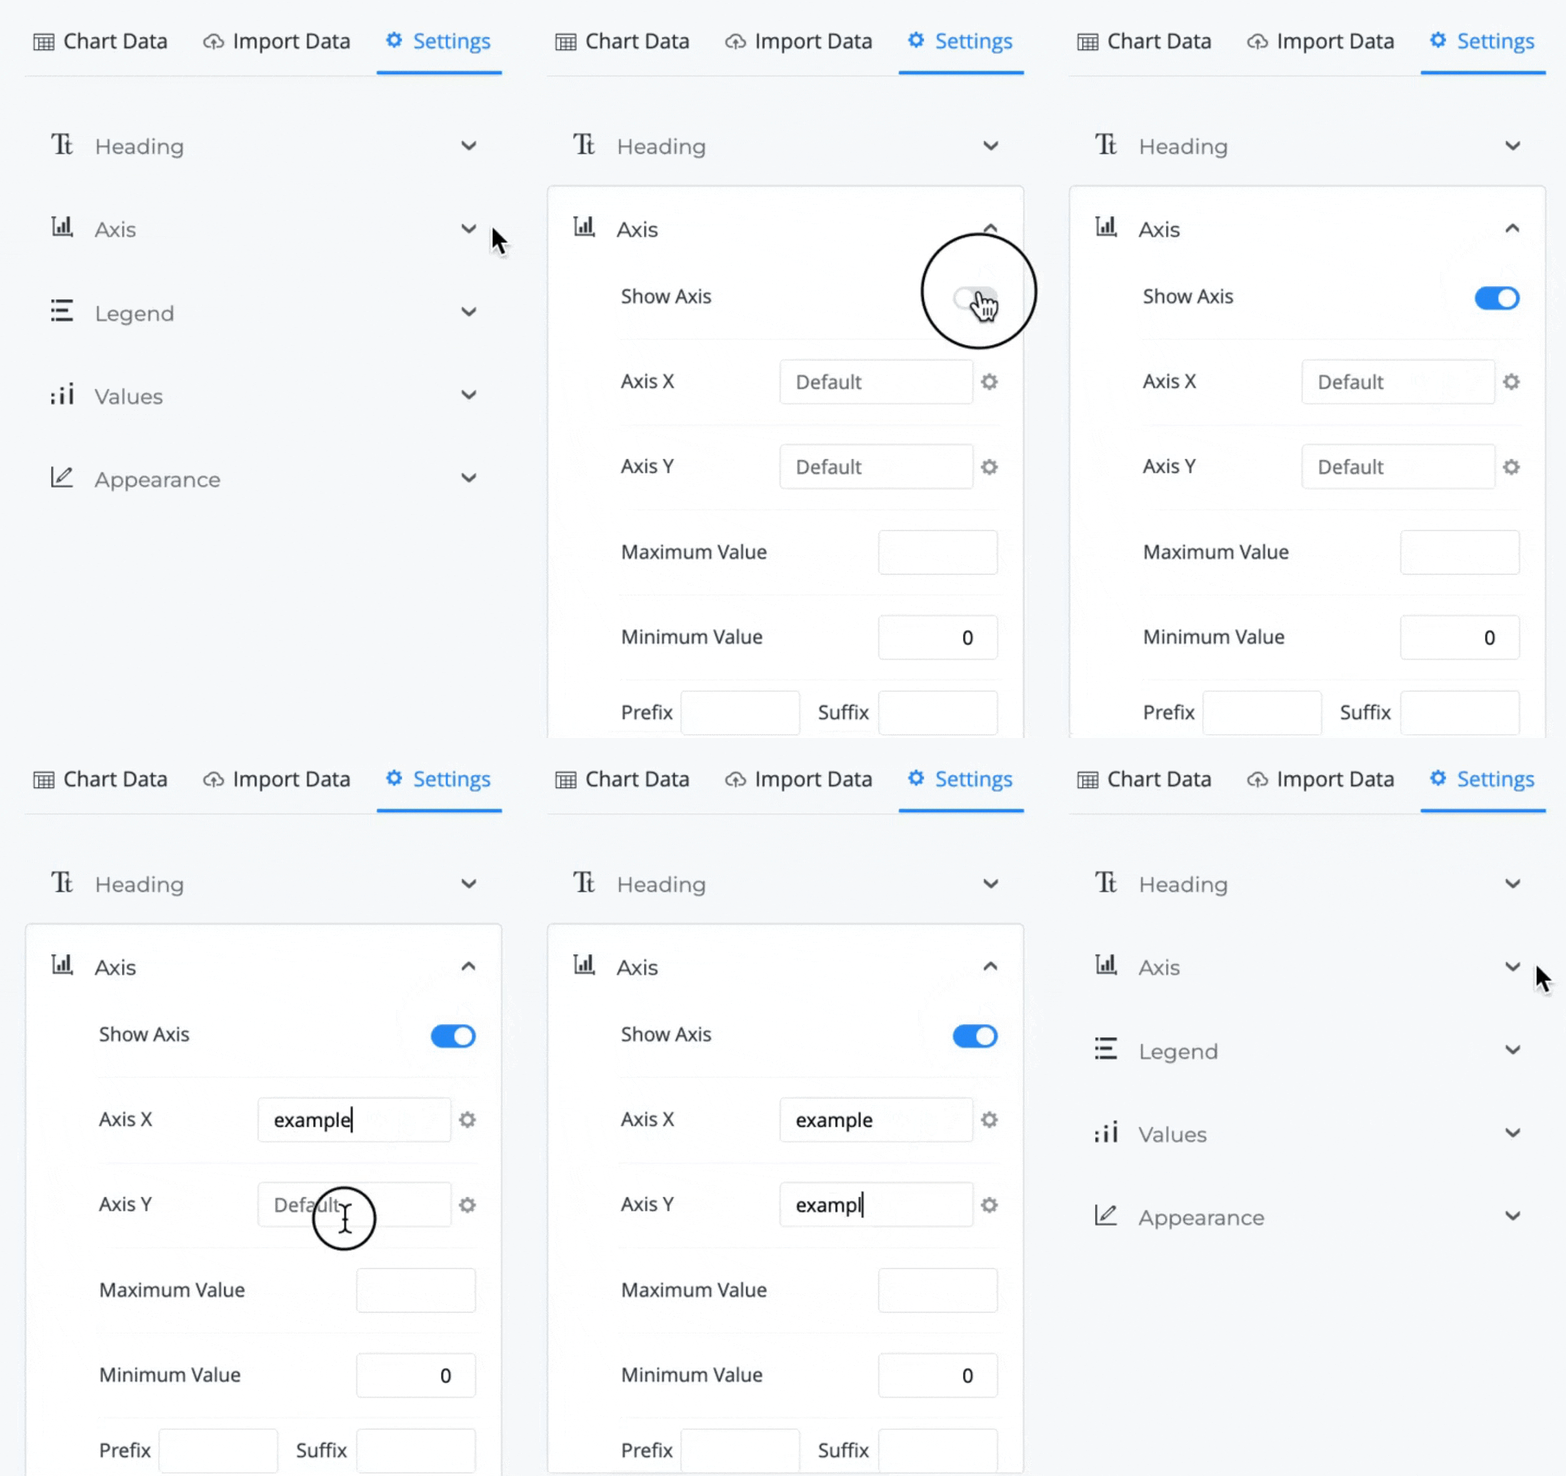
Under the Axis section, you can choose to hide the axis and adjust the angle of your labels, which comes in handy when dealing with long category labels.
In this section, you can also name your axis and customize the color,font type and size.
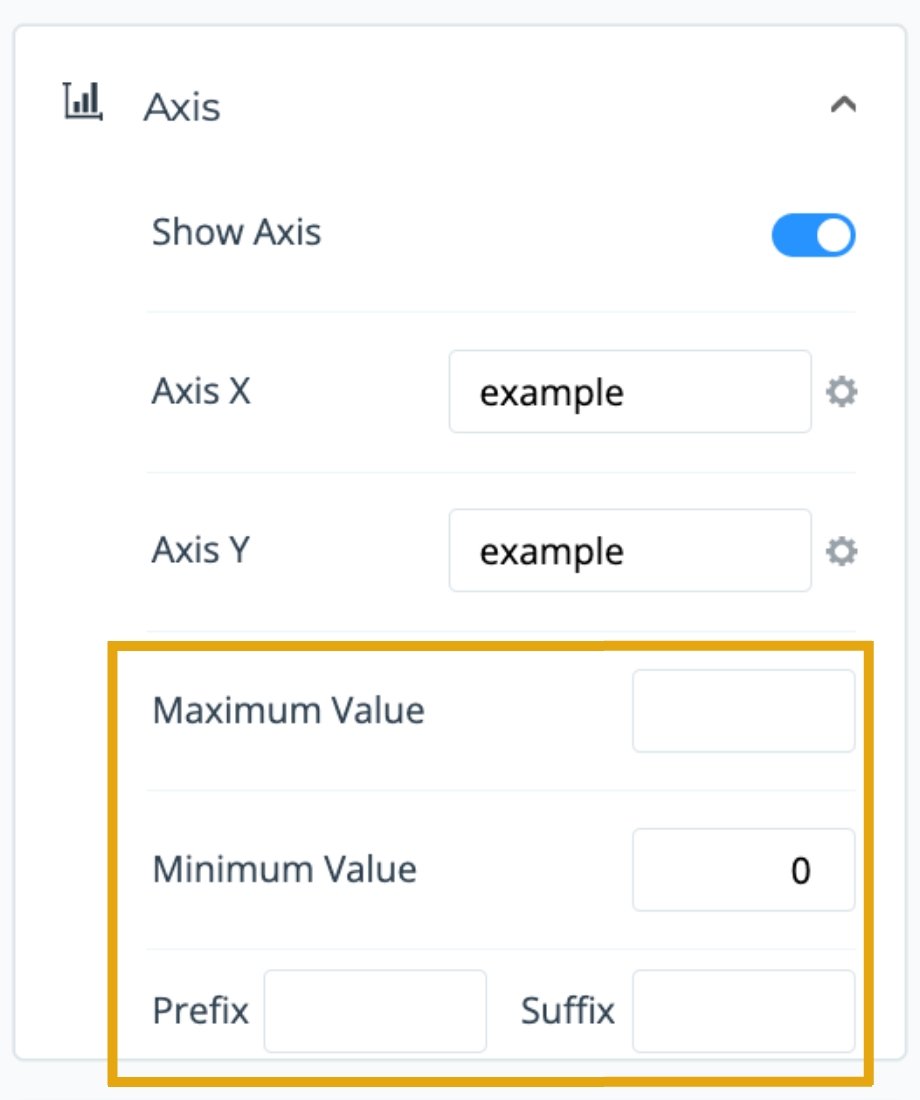
One useful customization setting is the ability to set specific minimum and maximum y-axis values. This allows you to adjust how your data points visualize according to the y-axis definition you apply. This may improve the visual representation of your data points if you do not have the y-axis start with a value of zero. Give it a try!
1
From the Axis section, turn the Show Axis switch ON/OFF and give your Axes a name by adding it to the text boxes.
2
Use the Maximum Value and the Minimum Value boxes to set specific minimum and maximum axis values and the Prefix and Suffix boxes to define them if needed.
3
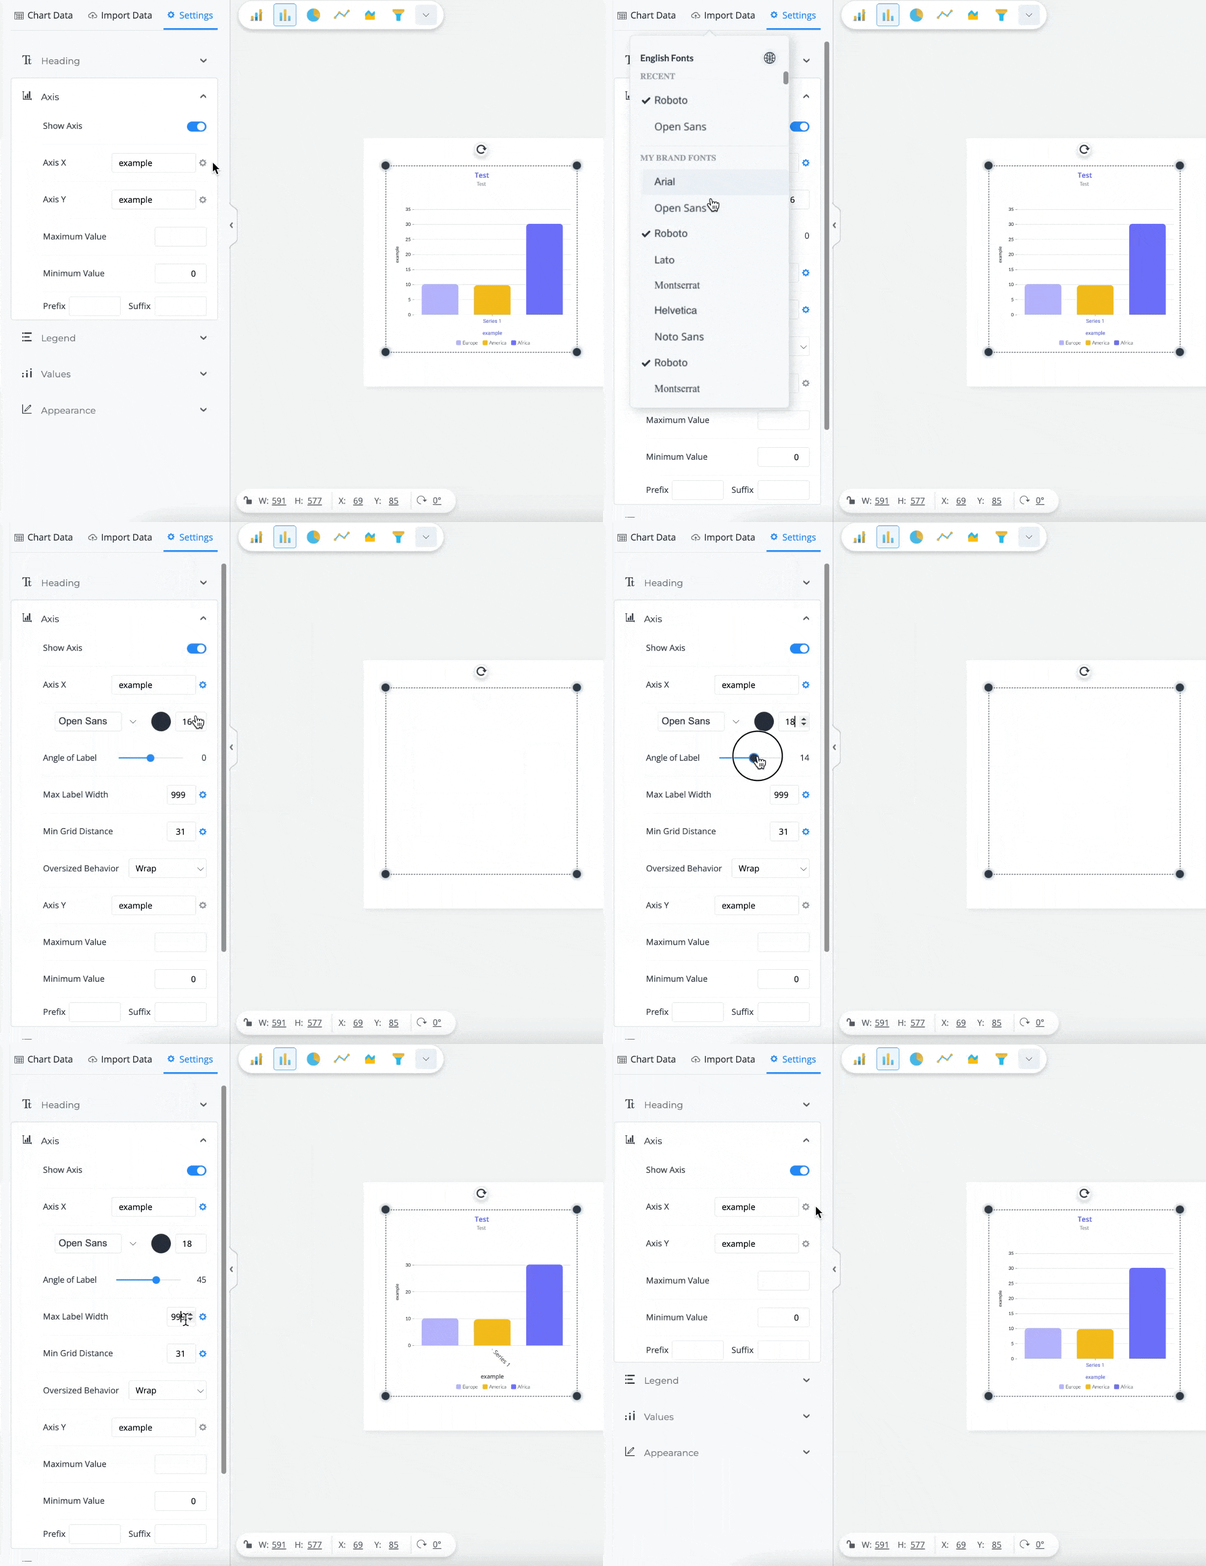
Click on the Gear Icon to customize the font, color, and font size of the axis names of your Graph or Chart. From there, you can also customize the Angle of Labels, and set the maximum Label Width and the minimum Grid Distance.
Legend
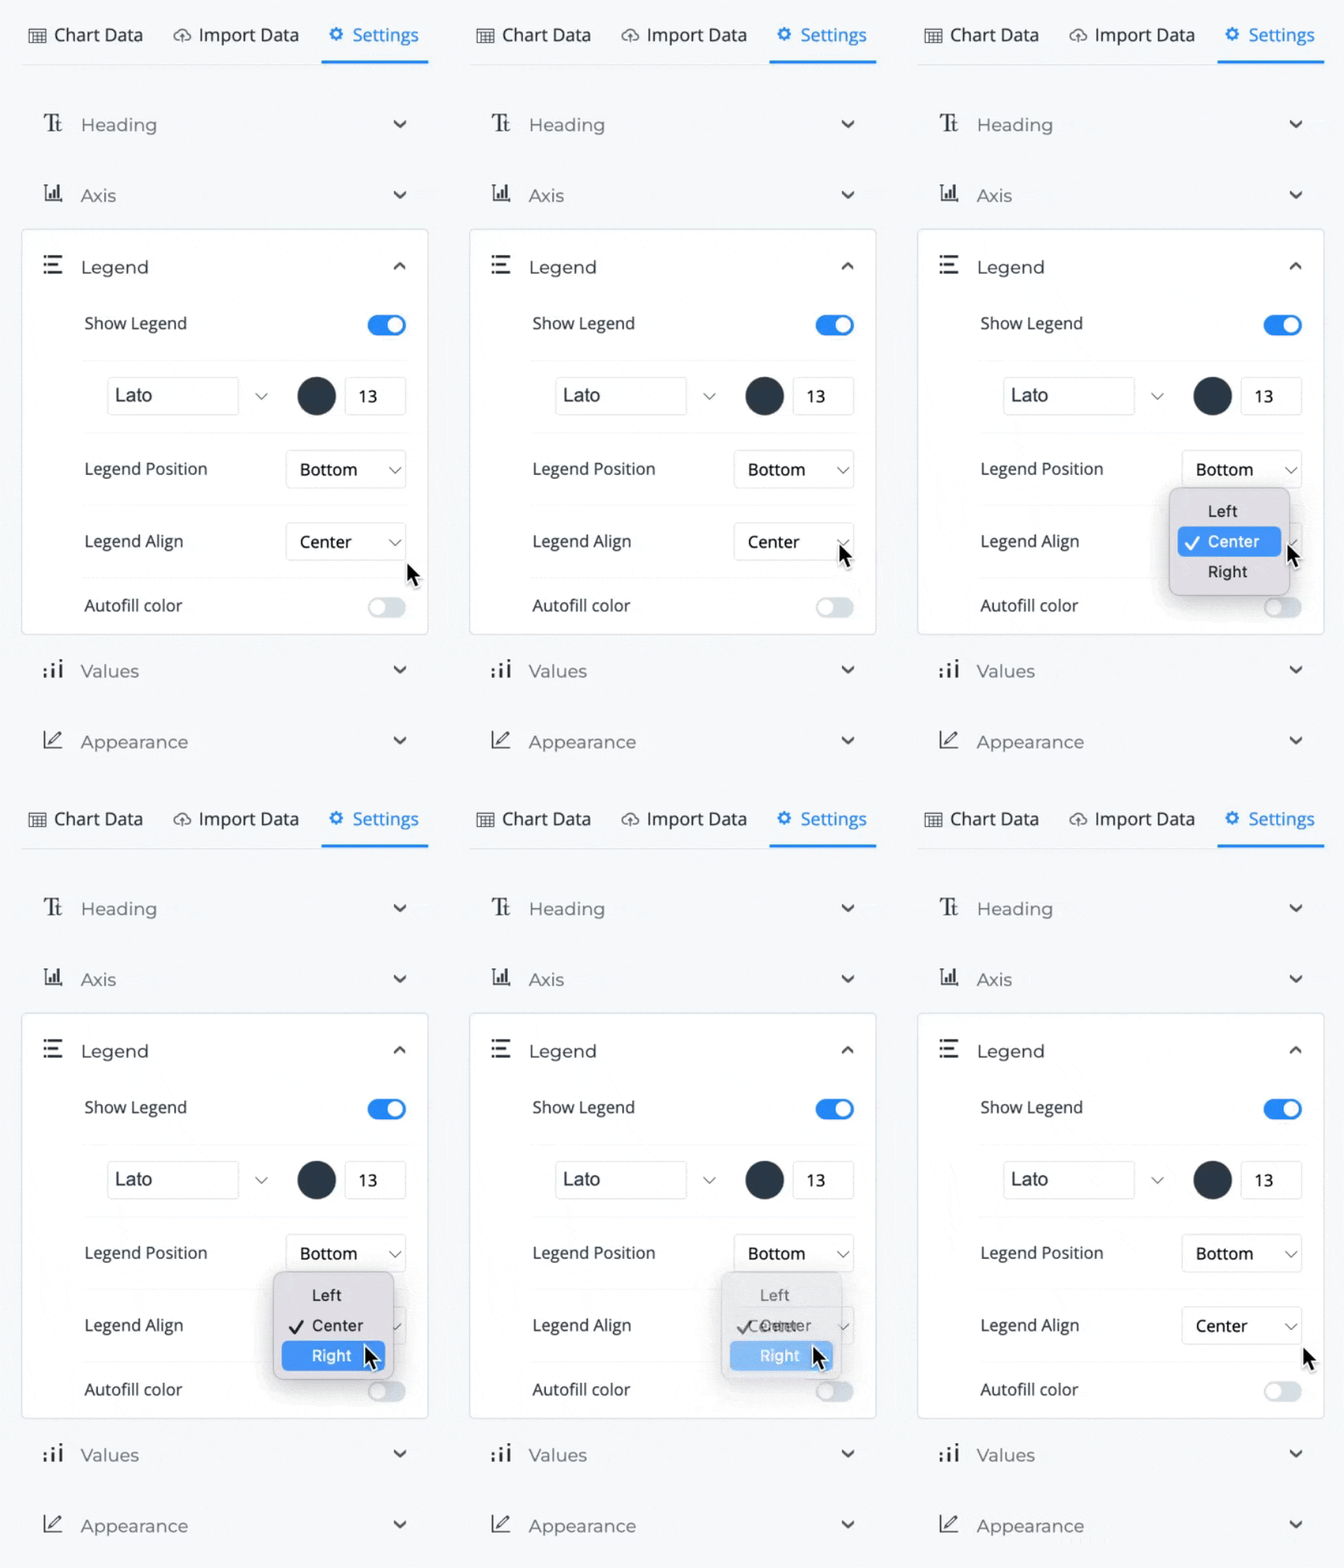
Under the Legend section, you can choose to hide your legend by turning ON/OFF the Show Legend. You can also adjust the placement of your legend so it appears either at the bottom, top, right, or left of your chart. As with the other chart elements, you can adjust the font, size, color, as well as its alignment.
1
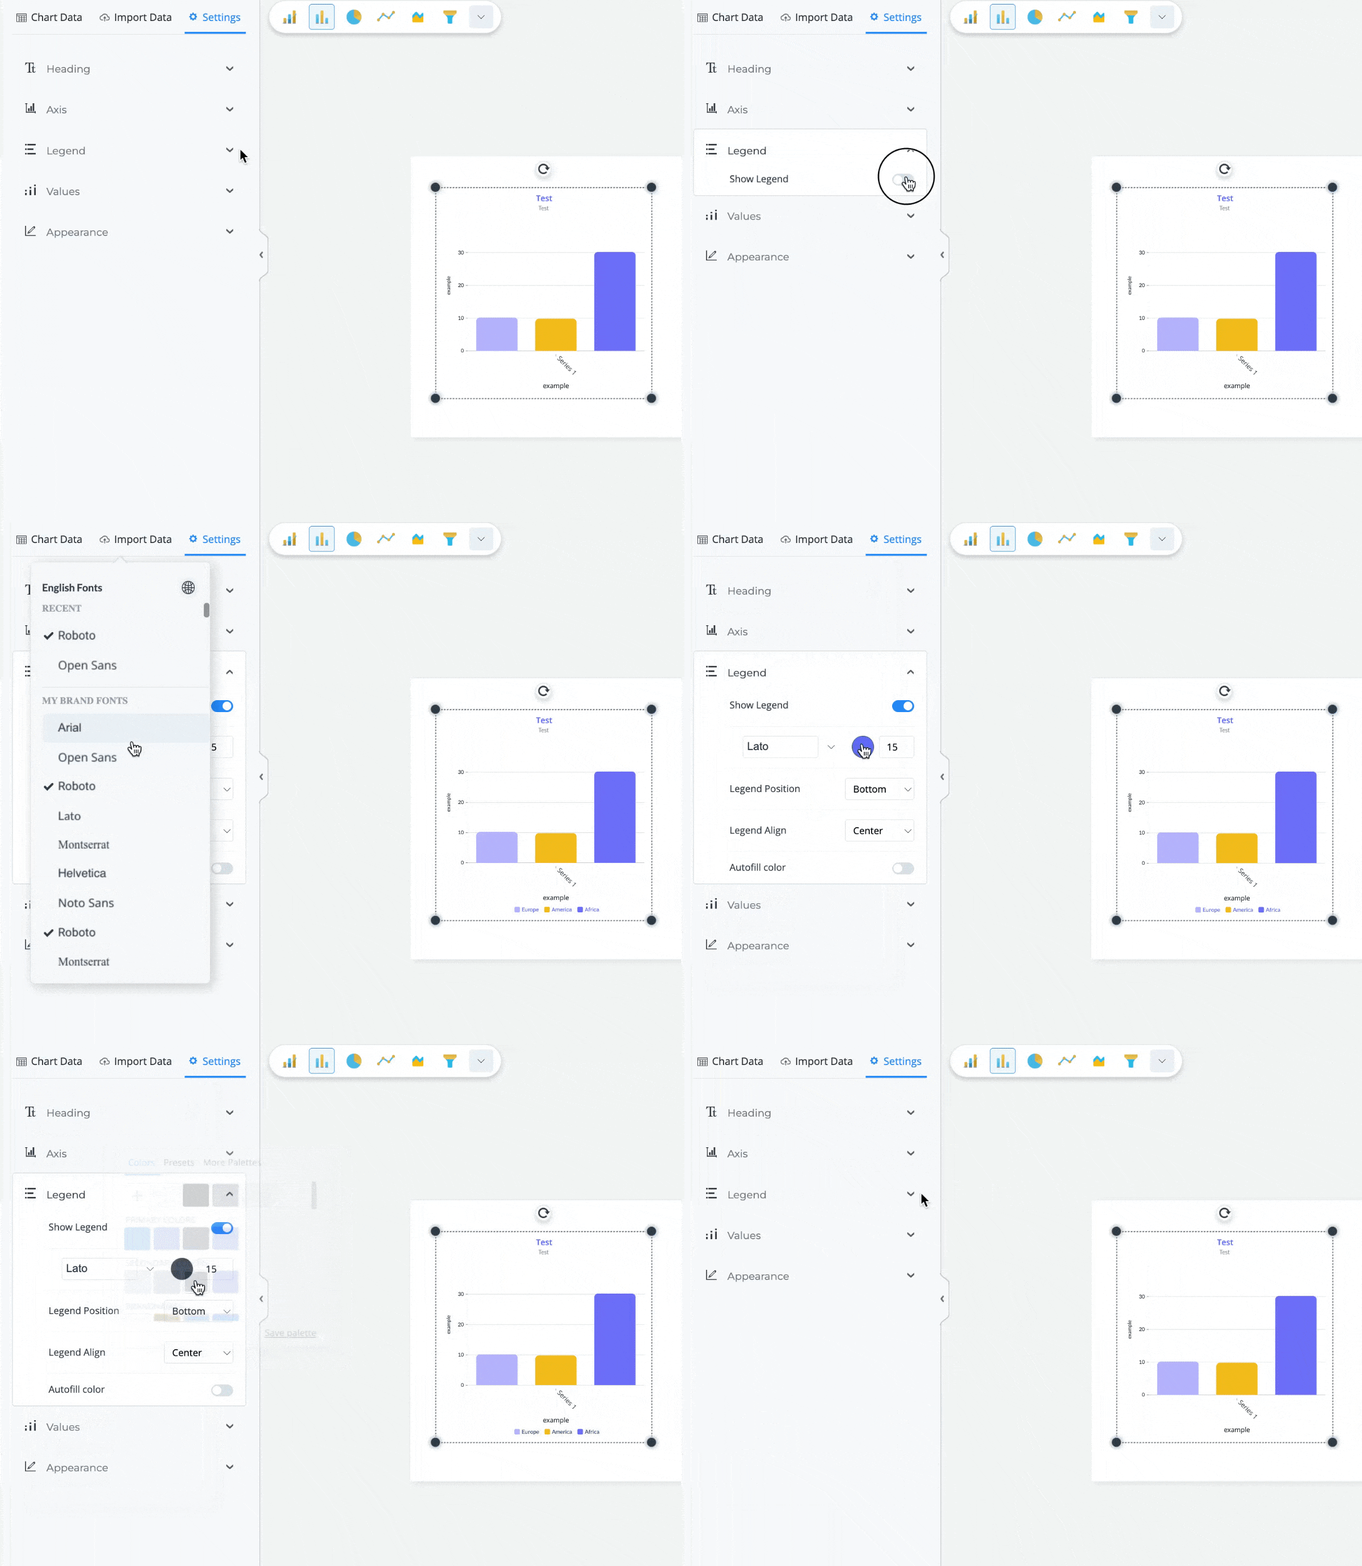
From the Legend section, turn the Show Legend switch ON/OFF. You can then customize the font, color, and point size of the Legend of your Graph or Chart.
2
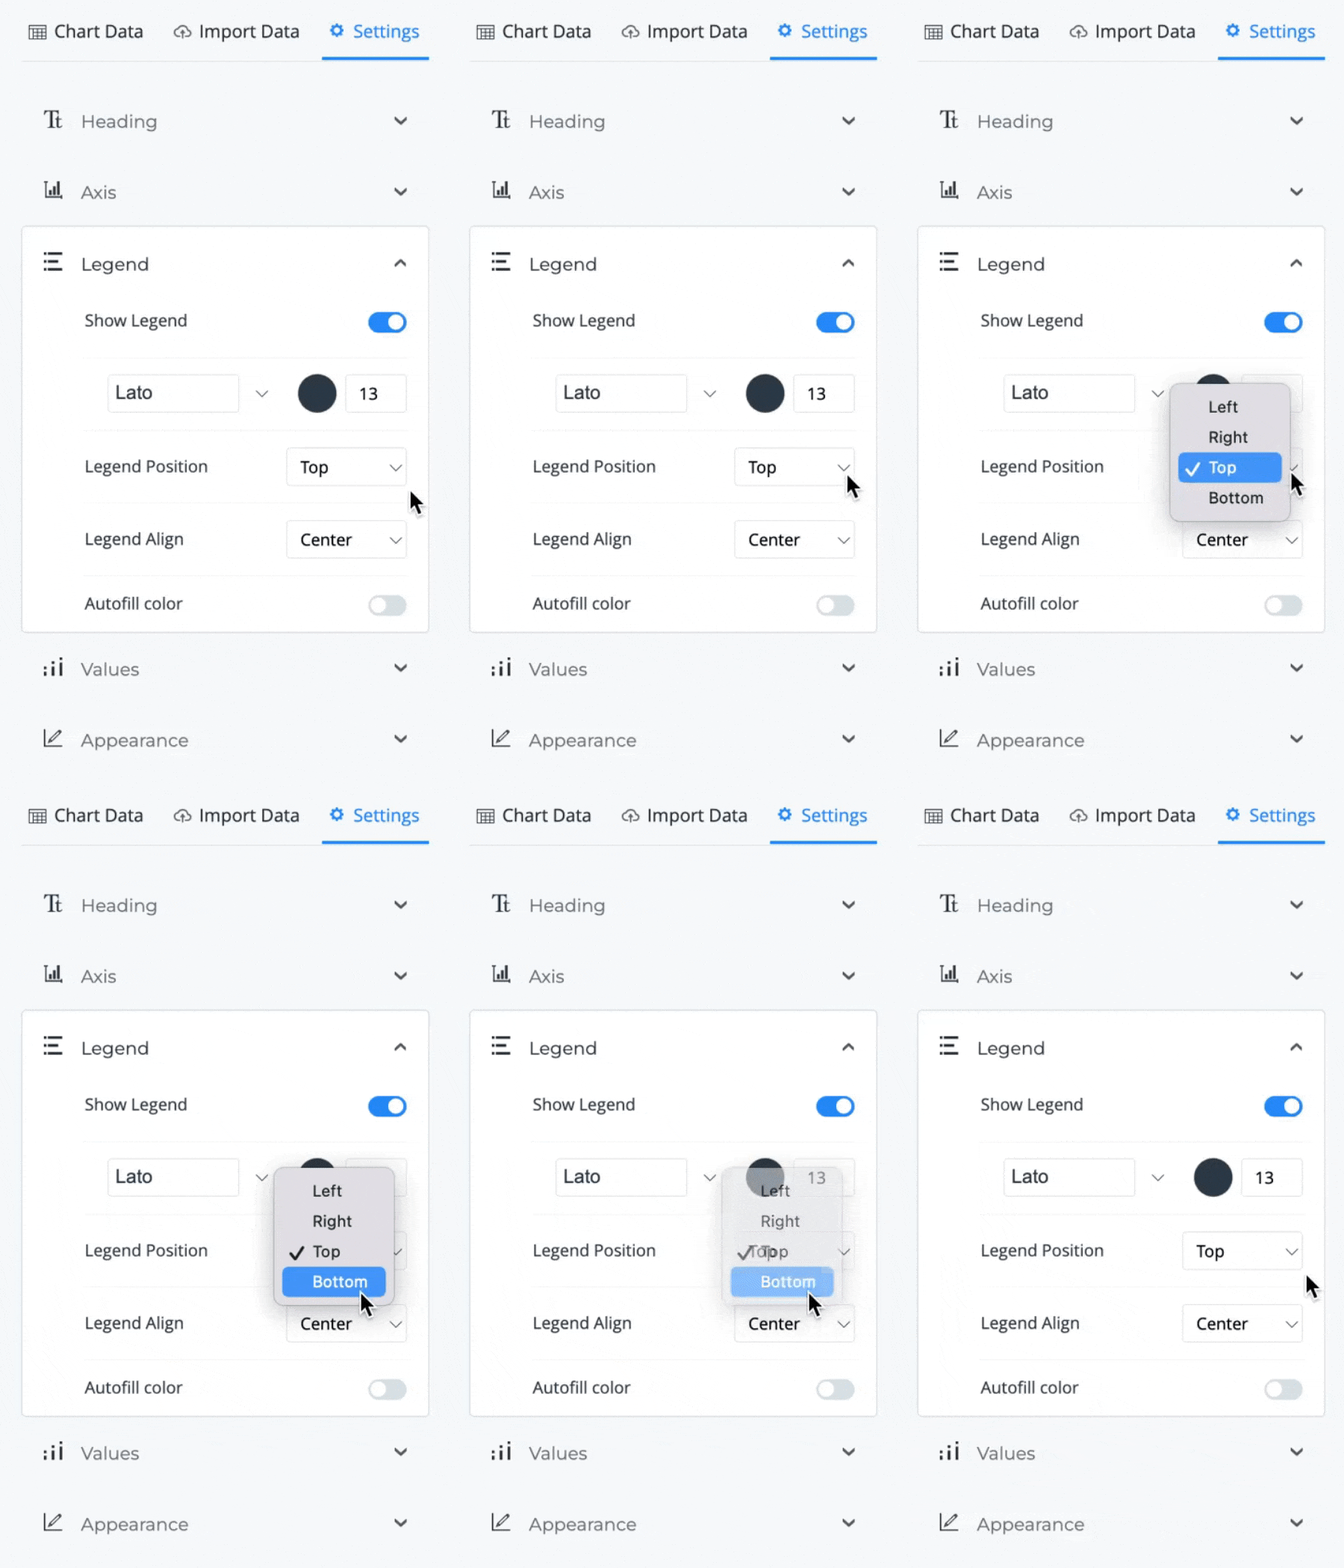
Use the Legend Position dropdown menu to adjust the placement of the legend. You can select it to appear at the bottom, top, right, or left of your Graph or Chart.
3
Use the Legend Align dropdown menu to adjust the alignment of the legend. You can align the legend to the left, center, or right.
4
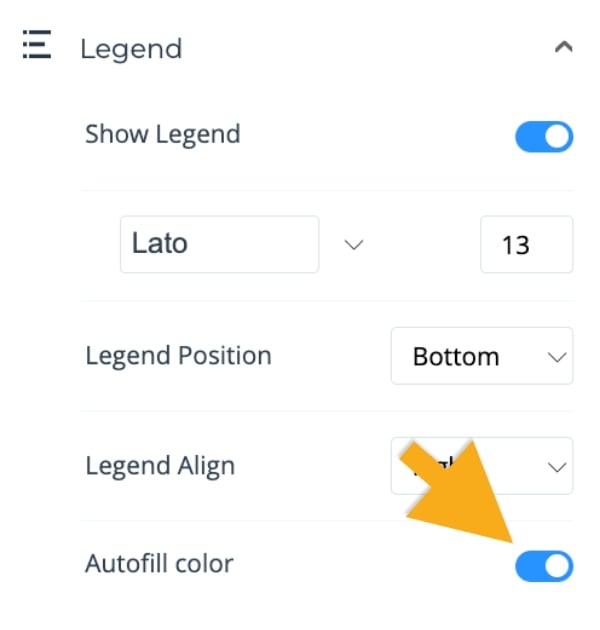
Turn the Autofill Color switch ON to make each legend of your Graph or Chart the same color as the set of data that represents.
Values
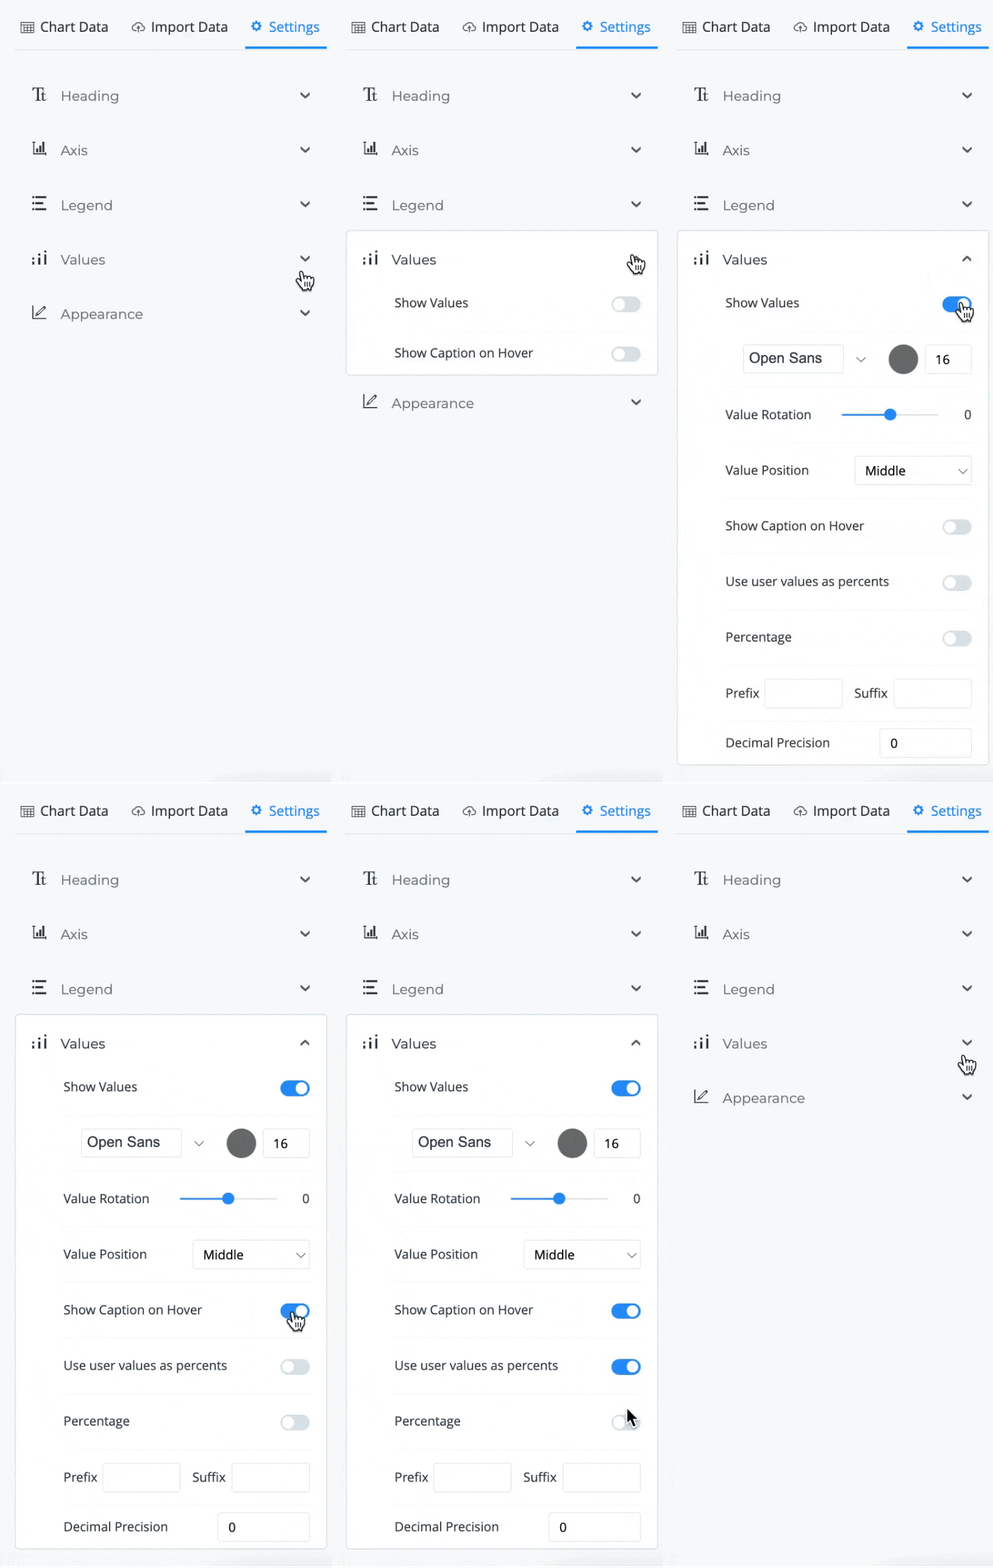
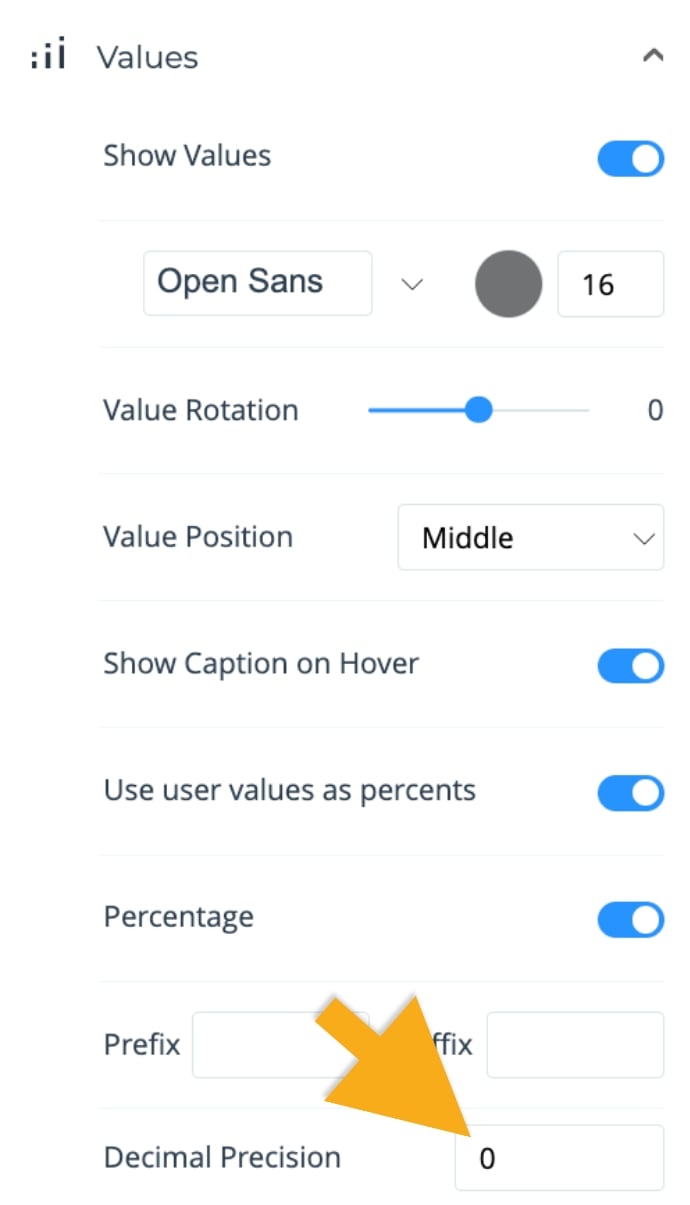
Under the Values section, you can choose to hide the values and define if you want to show a caption when hovering over the values and if you want to use the values as percentages. You can also define prefixes and suffixes and set a decimal precision for all the values in your Graph or Chart.
1
From the Values section, turn the switches ON/OFF to define if you want to Show Values in your Graph or Chart, Show Captions on Hover when presenting, Use the Values as Percents and activate Percentage on your values.
2
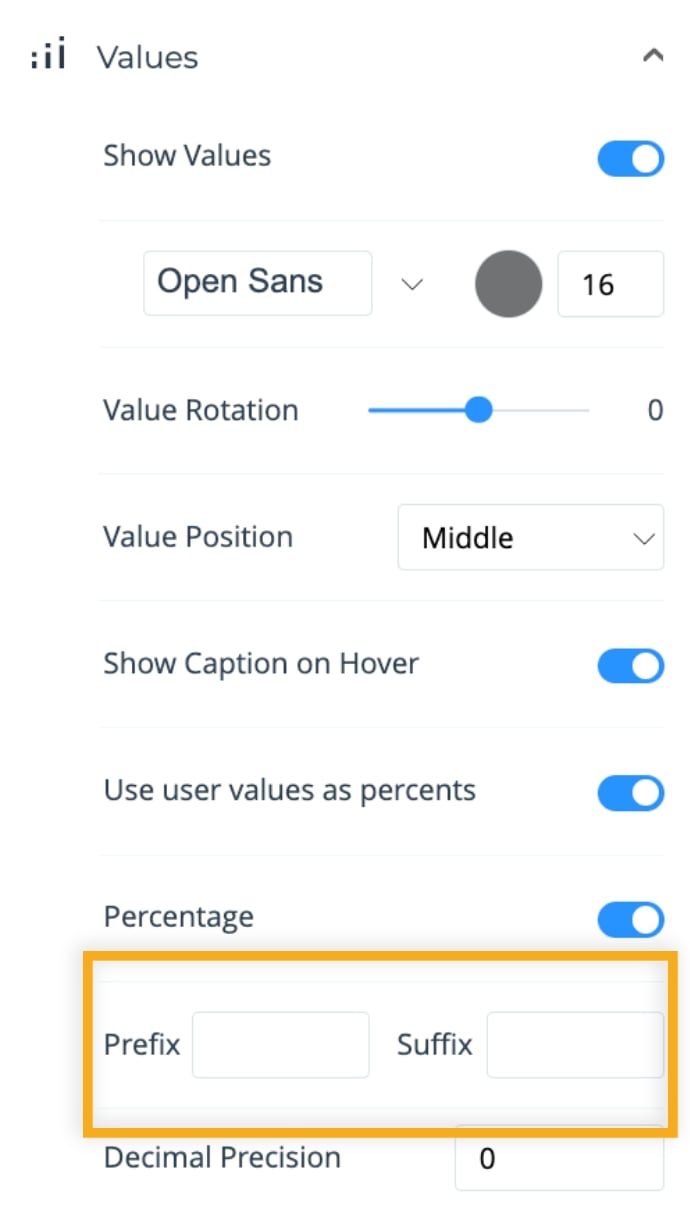
Use the boxes at the bottom to set the Prefix and Suffix values if needed.
3
Fill the Decimal Precision box to define the number of digits that will be displayed in the values of your Graph or Chart.
Appearance
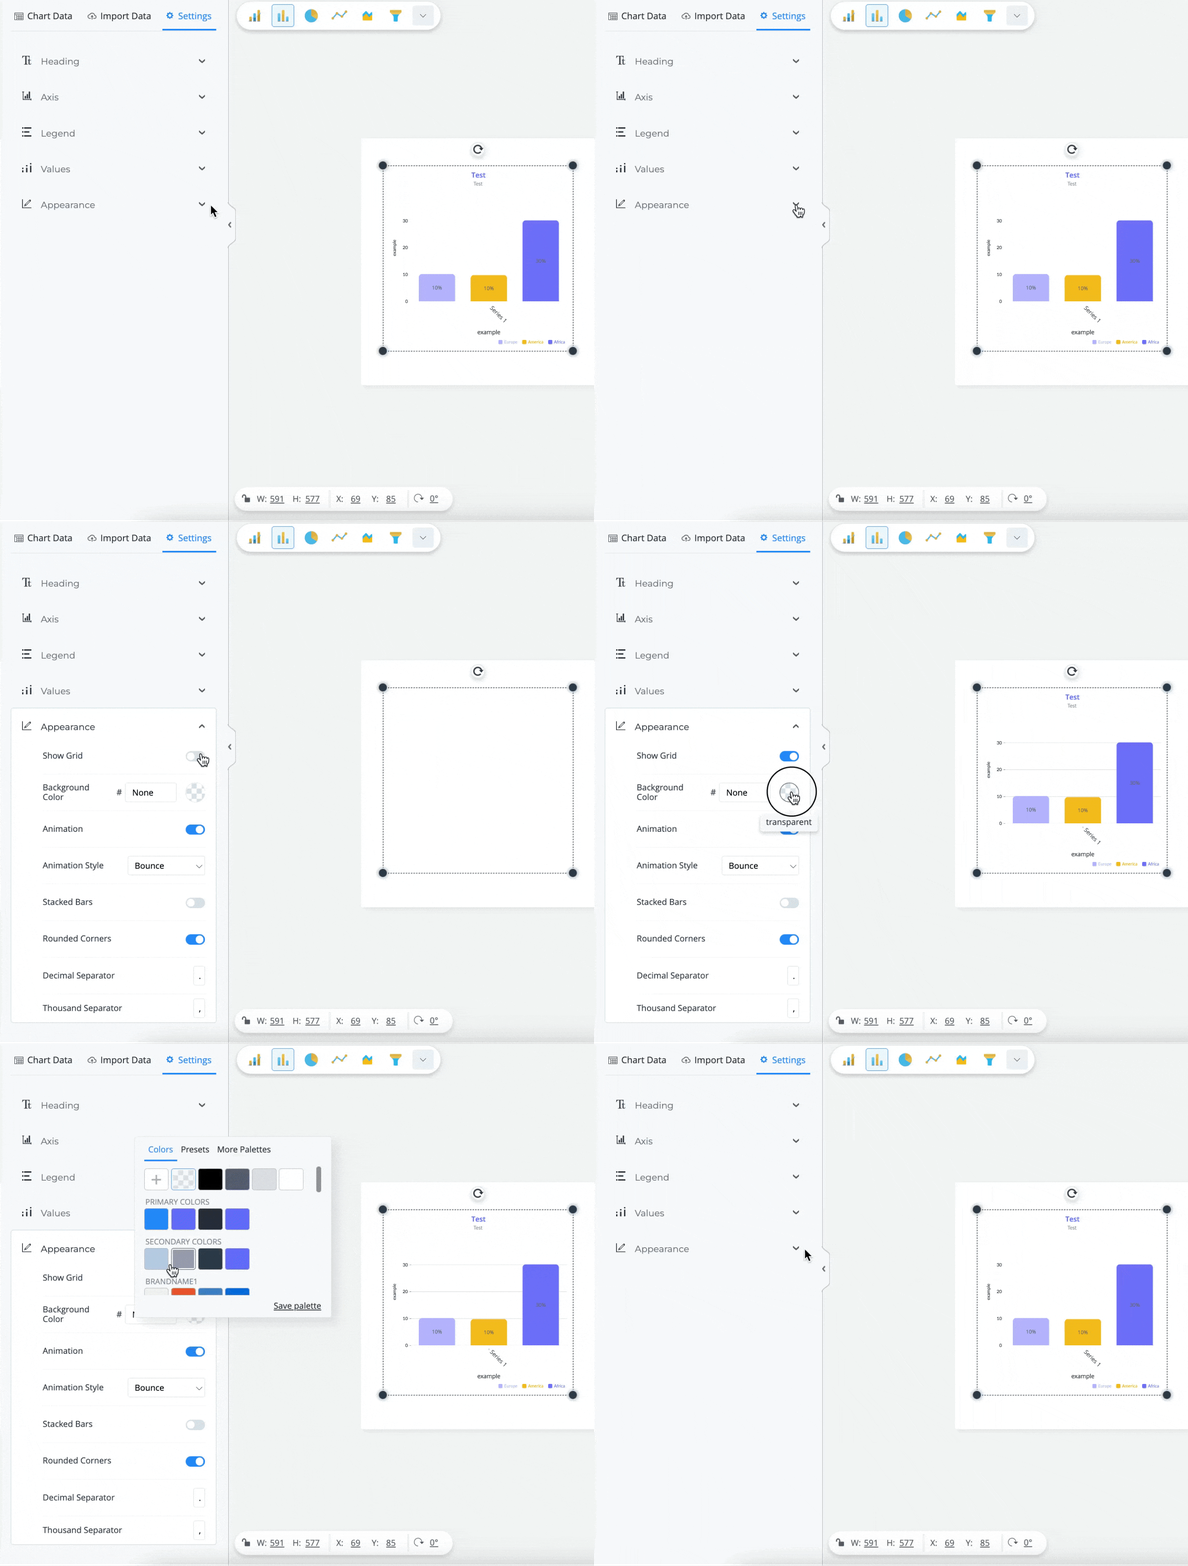
Under the Appearance section, you’ll see different customization options such as turn the grid on/off and change the background color or leave it transparent.
1
From the Appearance section, turn the Show Grid switch ON/OFF. You can then customize the Background Color by choosing a color from the color menu.
2
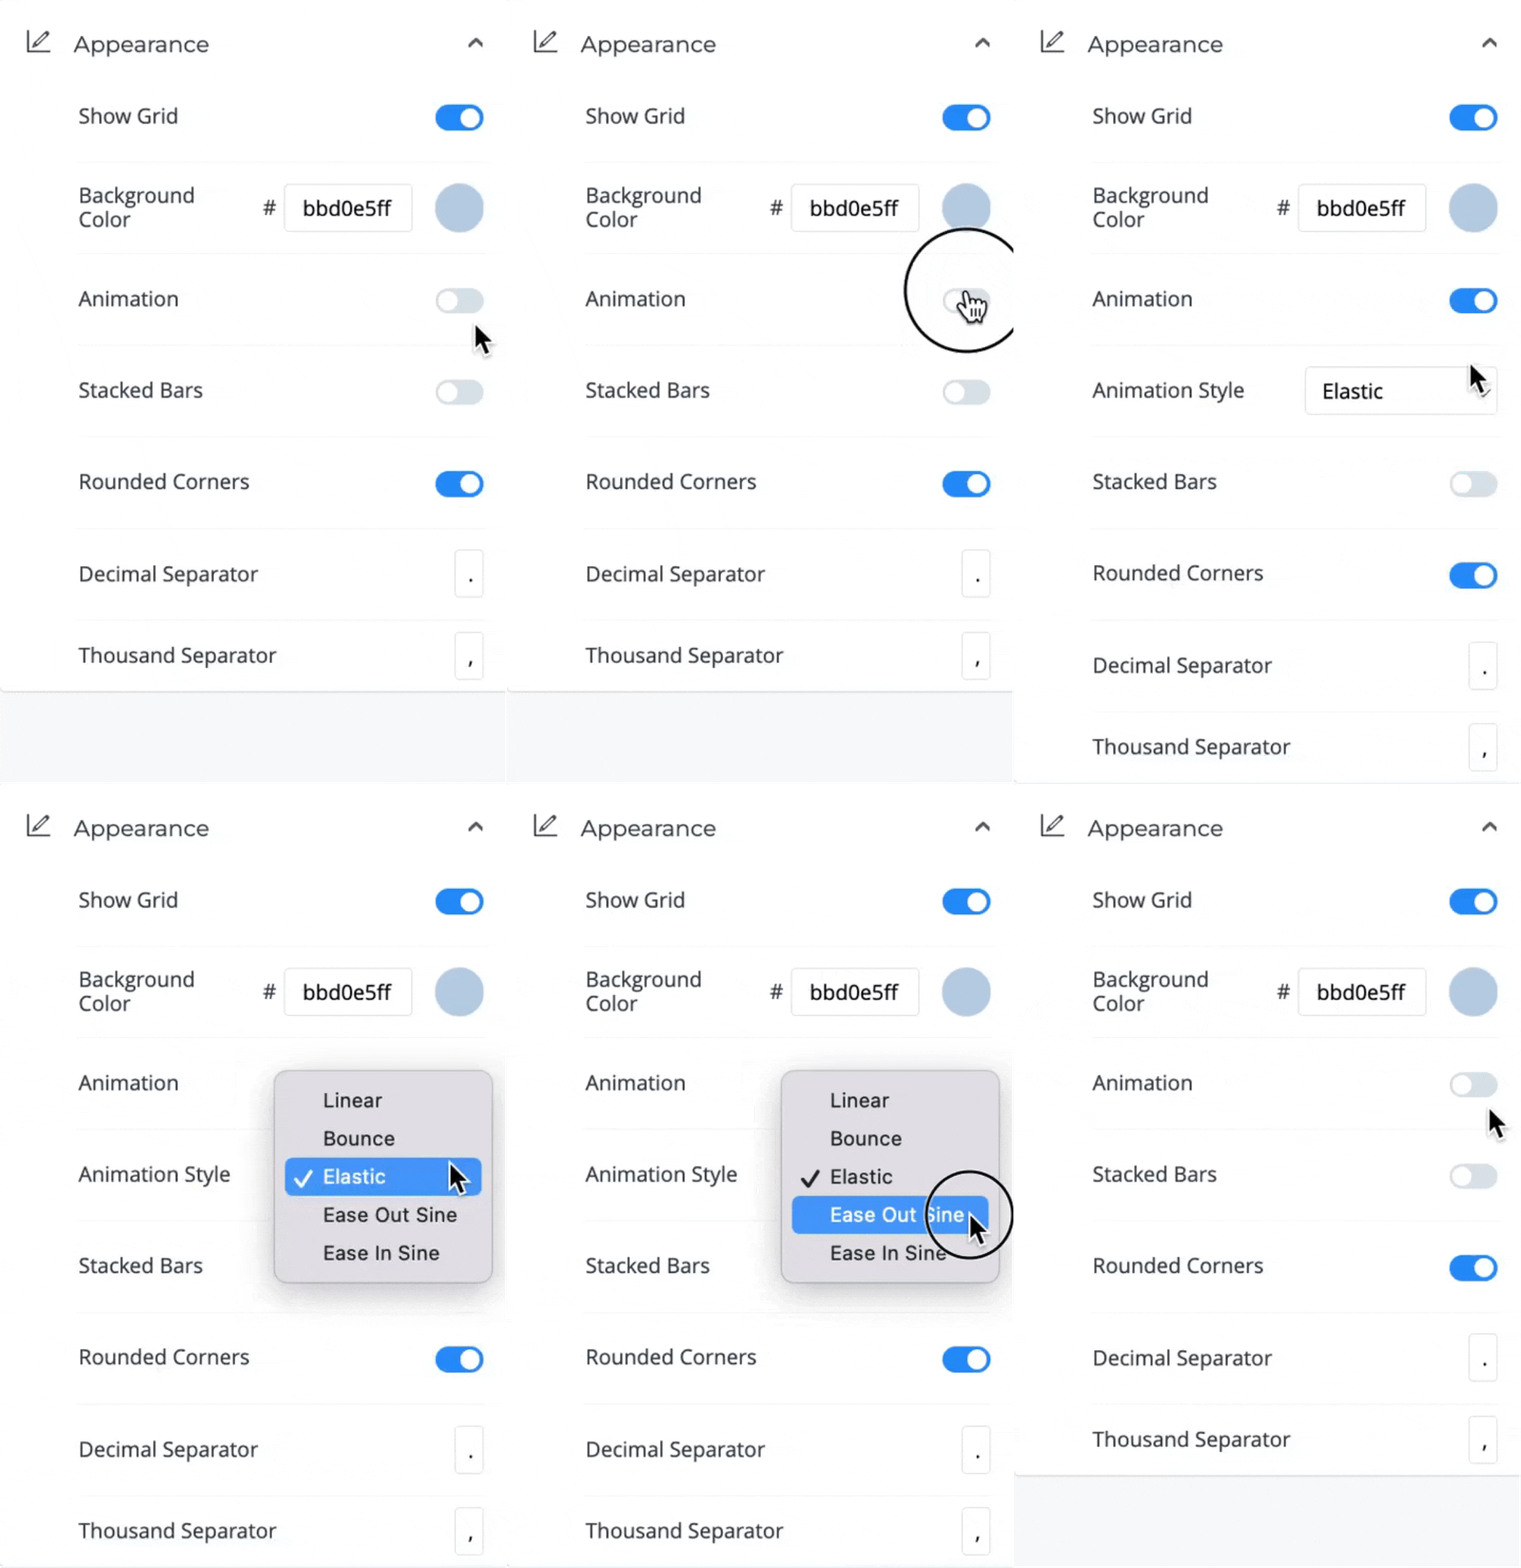
Turn the Animation switch ON if you want to animate your graph. Then, choose the Animation Style from the dropdown menu below the switch.
3
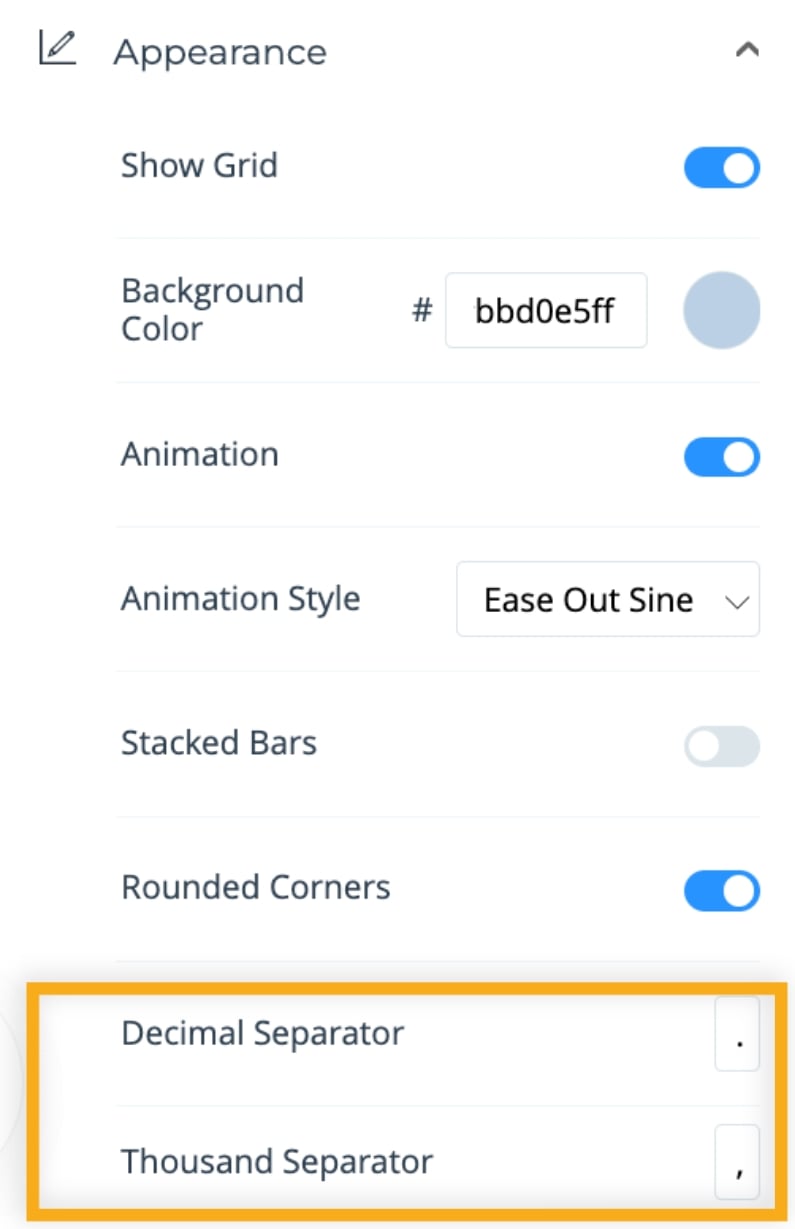
Use the boxes at the bottom to set the Decimals Separators and Thousands Separators.
Note: For pie and doughnut charts, you’ll see an additional setting that allows you to adjust the angle of your chart so that you can position certain segments at a specific degree.
Note: For bar graph or line graph, you’ll also be able to select Graph types and turn the point markers on/off. You can also stack the bars of your charts by turning the “Stacked Bars” switch ON.


