Learn how Visme will change the way you create stunning content.
Reserve your seatReports are thorough summaries of data, findings, or activities. They prove to be effective tools for simplifying complex information, making it easy to understand, and facilitating communication and analysis – ultimately to support informed decision-making. Reports also promote follow-up action and direction for people to move forward effectively or make changes to promote better outcomes. Therefore, the visual effectiveness of your reports is paramount.
In this article, we’ll explore the fundamental concept of reports and offer detailed guidance on utilizing Visme to craft visually appealing, informative and effective reports that cater to your specific requirements.
Relevant Resources to help you learn more about Reports
Below is a collection of learning resources to help you hone in on your Reports and create comprehensive and impactful documents tailored to your specific needs.
– 44 Business Report Templates for Professional Reports (2024)
– 45+ Annual Report Design Templates & Awesome Examples (2024)
– Report Writing Format with Templates and Sample Report
How to Start your Report
Report Templates: Here you can find a vast collection of ready-to-use design templates to browse, which are all available in Visme to jumpstart your Report. Once you find the template you like, select it to log into Visme and start working on it within the editor.
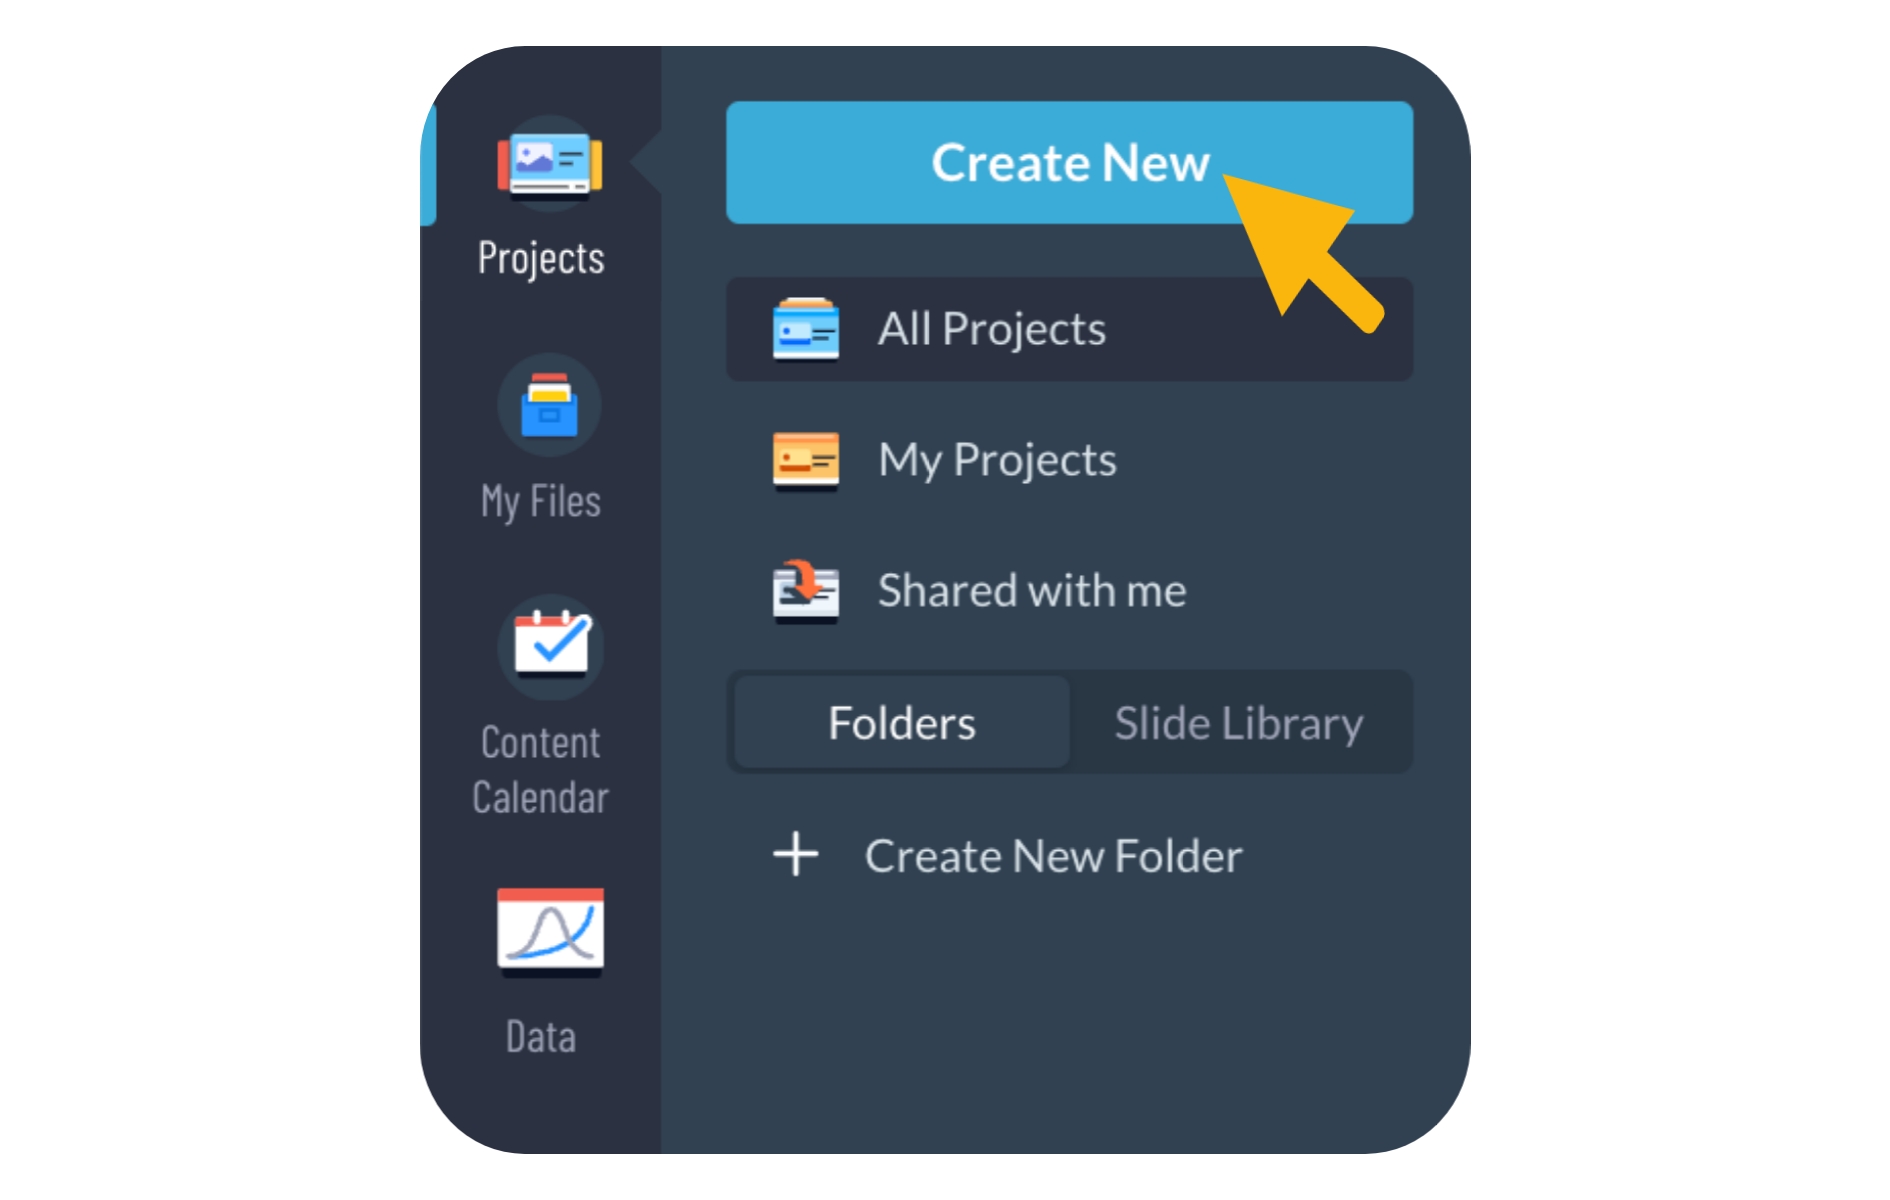
To create your Newsletter from within Visme:


Key elements your Report should include:
Title: A clear and concise report title that briefs the subject matter.
Table of Contents: A page dedicated to outlining the contents and structure of the report, providing a quick reference for readers.
Summary: An overview of the entire report, summarizing key findings and insights. This section should be written after completing the full report.
Introduction: Introduce the report topic, providing context and outlining what readers can expect to find in the body and specific sections.
Body: The longest section of the report, encompassing all gathered information and utilizing data visualization techniques to enhance presentation. There is the potential that your report may have several subsections within the body for you to keep specific topics and points of reporting centralized.
Conclusion: Different from the summary, the conclusion section wraps up the report body by summarizing key points and findings.
Recommendations: Provide a set of recommended goals or steps based on the information presented in the report, offering actionable insights for decision-making.
Appendices: A list of sources used to compile the information in the report, ensuring transparency and allowing readers to explore further if needed.
Special Touches in Visme for your Reports
Below is a list of great elements you can incorporate into your project to optimize your Report’s overall appeal and effectiveness.
Visuals: Images: Use Visme’s extensive libraries of images, graphics, and icons, and integrate your personal touch by uploading your images to illustrate key points in your narrative
Data Visualization: Include compelling charts, graphs,maps, tables, and data widgets to effectively present complex information in an easily understandable format.
Get Feedback and Collaborate Seamlessly: Use Visme’s collaboration and commenting features to get feedback from others on the report or gain input for specific data points that you need to receive from someone else to complete the report. Better yet, bring your collaborators into Visme with you so everyone can co-create the report in real time together using Visme’s team sharing features and workflows.
Add Videos: Add videos directly into your report or add a video recording to a data object, allowing you to provide a video explanation of a more complex concept or data visual in the report.
Use Interactivity to Unveil More Information: Incorporate interactivity strategically to unveil more data and information gradually. Visme’s interactive features with pop-up, hover effects, and hotspots help you keep visuals simple and allow viewers to interact with specific areas of the report to reveal and review more details.
Flipbook Effect: Transform your report into an interactive experience with a dynamic flipbook effect. This is great for reports that you plan to deliver for public viewing online – creating an impressive experience where viewers feel like they are flipping the pages of a magazine to reveal your report findings.
How to Export and Share your Report
Now that your project is completed, learning how you showcase and share it with your audience is the next key step. Let’s review Visme’s export and sharing options below to help you determine which one is right for your Report.
Export Options:
Download your Report for Print – To obtain a high-quality and professional print for your Report, download it as a PDF with bleed marks. Here’s how to Download as a PDF with Bleed Marks.
Sharing Options:
Publish your Report – Publish your Report and make it accessible to your desired audience through a shareable link or by publishing it on social media. Here’s how to publish and share your Visme project.
Share your Report privately – Share your Report with a select few using a shareable link, while keeping it private from the rest of the world. Here’s how to share your Visme project privately.
Embed your Report on a Website – Embedding your Report on a website enables people to access and engage with your content easily and directly on the site. Here’s how to embed a Visme project on a website.
